Fig. 4
Download original image
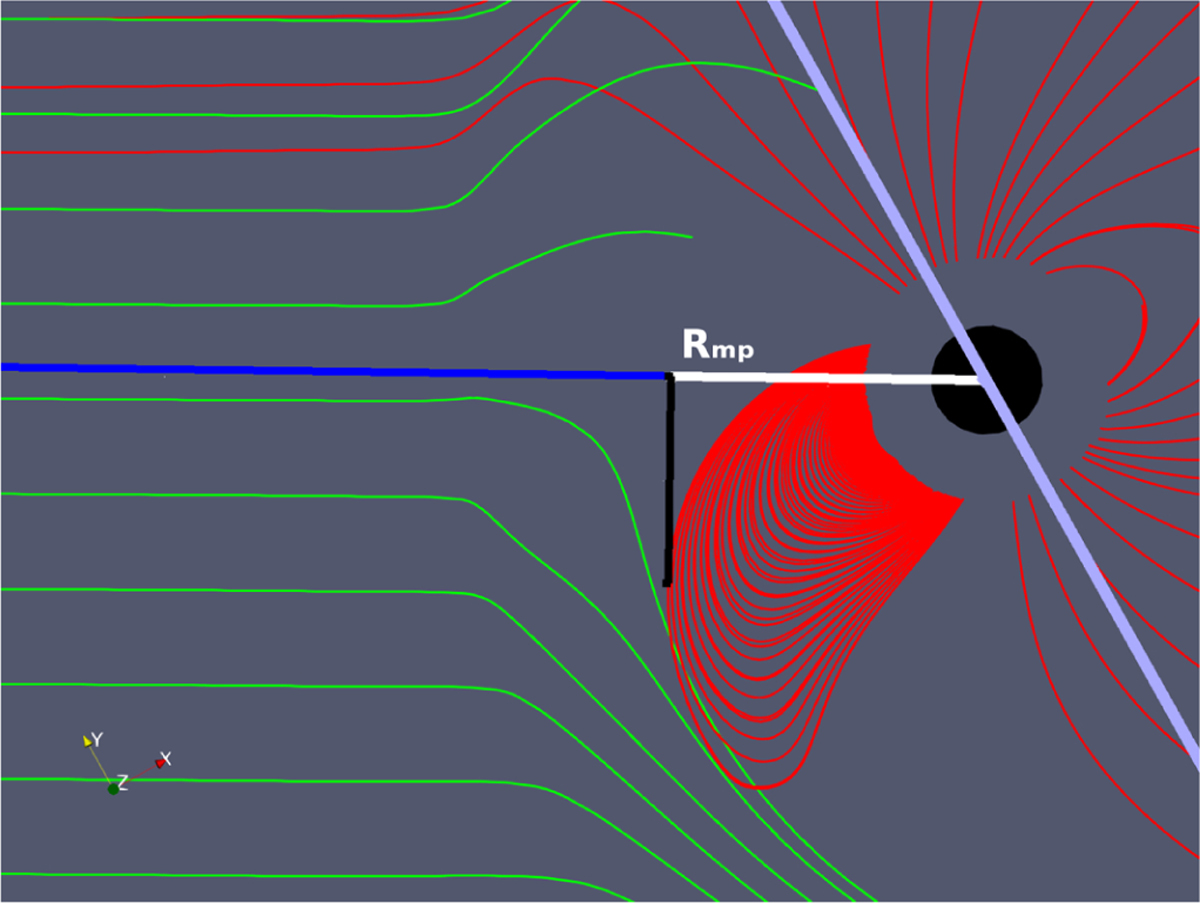
Illustration of the measurement of the magnetopause standoff distance in our simulations. The black circle corresponds to the planet. The standoff distance is the radial distance (white line) to the projection of the last closed magnetic field of the planet (in red) on the line connecting the star and the planet (in blue). The simulation depicted here corresponds to a super-Alfvénic case, where the inclination of the magnetic axis of the planet with respect to the ecliptic is 30° (purple line) and Bp = 0.32 G.
Current usage metrics show cumulative count of Article Views (full-text article views including HTML views, PDF and ePub downloads, according to the available data) and Abstracts Views on Vision4Press platform.
Data correspond to usage on the plateform after 2015. The current usage metrics is available 48-96 hours after online publication and is updated daily on week days.
Initial download of the metrics may take a while.