Open Access
Fig. 5
Download original image
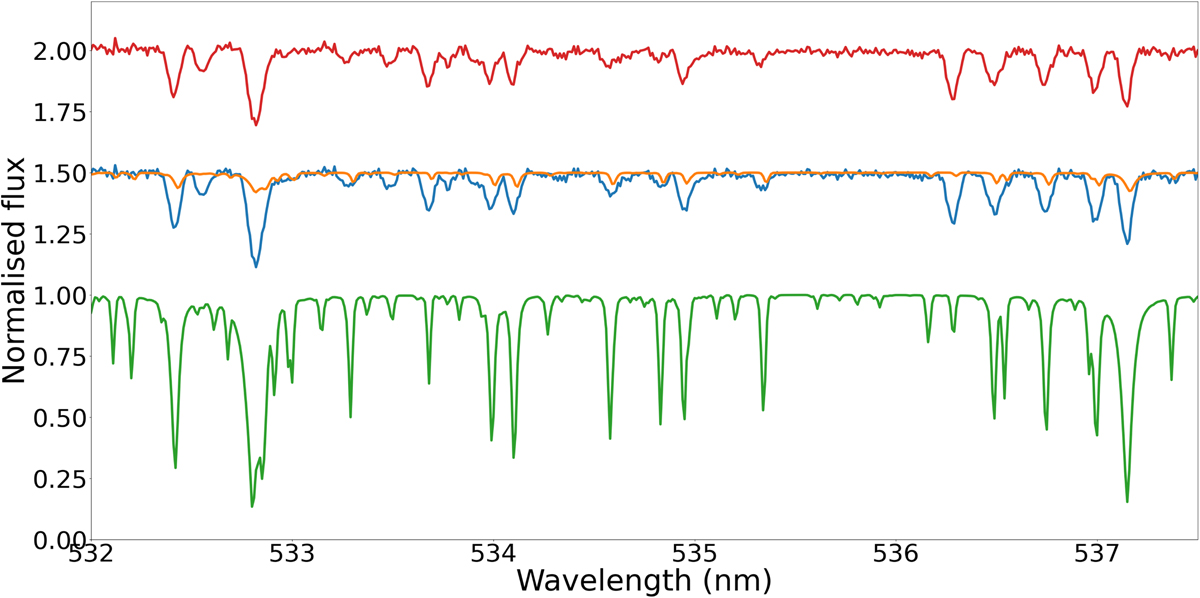
Comparison of the observed spectrum (blue line) with the G-type star synthetic spectrum (green line) shifted by offset. The orange spectrum represents the scaled green spectrum with respect to the brightness of the blended stellar companion. The red spectrum represents the spectrum of the primary star.
Current usage metrics show cumulative count of Article Views (full-text article views including HTML views, PDF and ePub downloads, according to the available data) and Abstracts Views on Vision4Press platform.
Data correspond to usage on the plateform after 2015. The current usage metrics is available 48-96 hours after online publication and is updated daily on week days.
Initial download of the metrics may take a while.