Fig. 15
Download original image
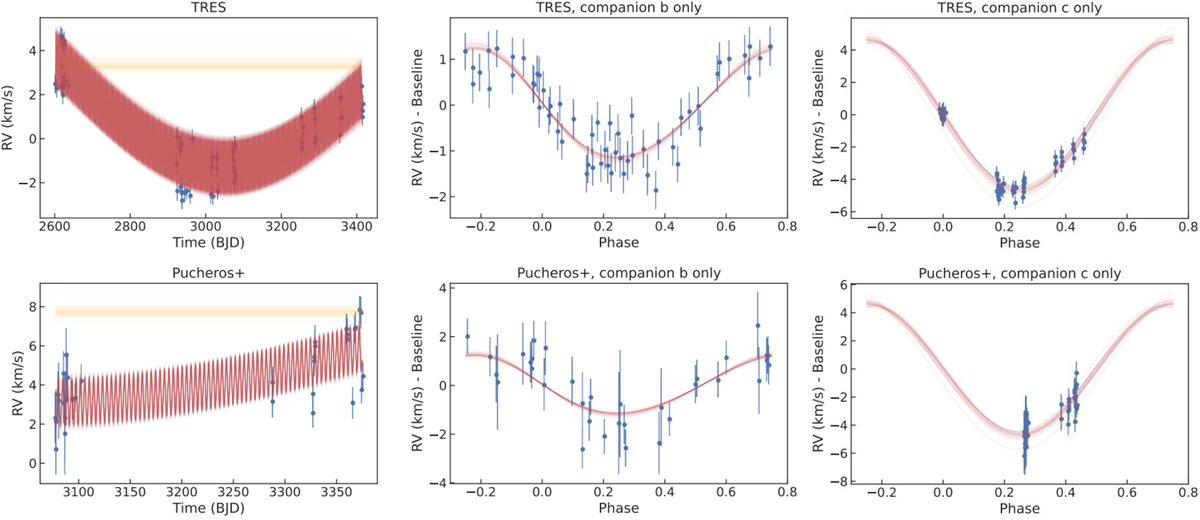
Radial velocity curve of BD-14 3065, fitted with the allesfitter as described in Sect. 3.4. The blue points represent TRES and Pucheros+ data, and the red lines represent the best models that result from the same global fit of both datasets together. The decision to plot both datasets separately was based on the difference in their average uncertainties. For illustration purposes, we have plotted the shortest feasible circular orbit for BD-14 3065c. Hence, we have plotted a two-star model that assumes that the stellar companion BD-14 3065c does not cause significant dilution. We have subtracted a value of 2 457 000 from BJD time.
Current usage metrics show cumulative count of Article Views (full-text article views including HTML views, PDF and ePub downloads, according to the available data) and Abstracts Views on Vision4Press platform.
Data correspond to usage on the plateform after 2015. The current usage metrics is available 48-96 hours after online publication and is updated daily on week days.
Initial download of the metrics may take a while.