Fig. 1
Download original image
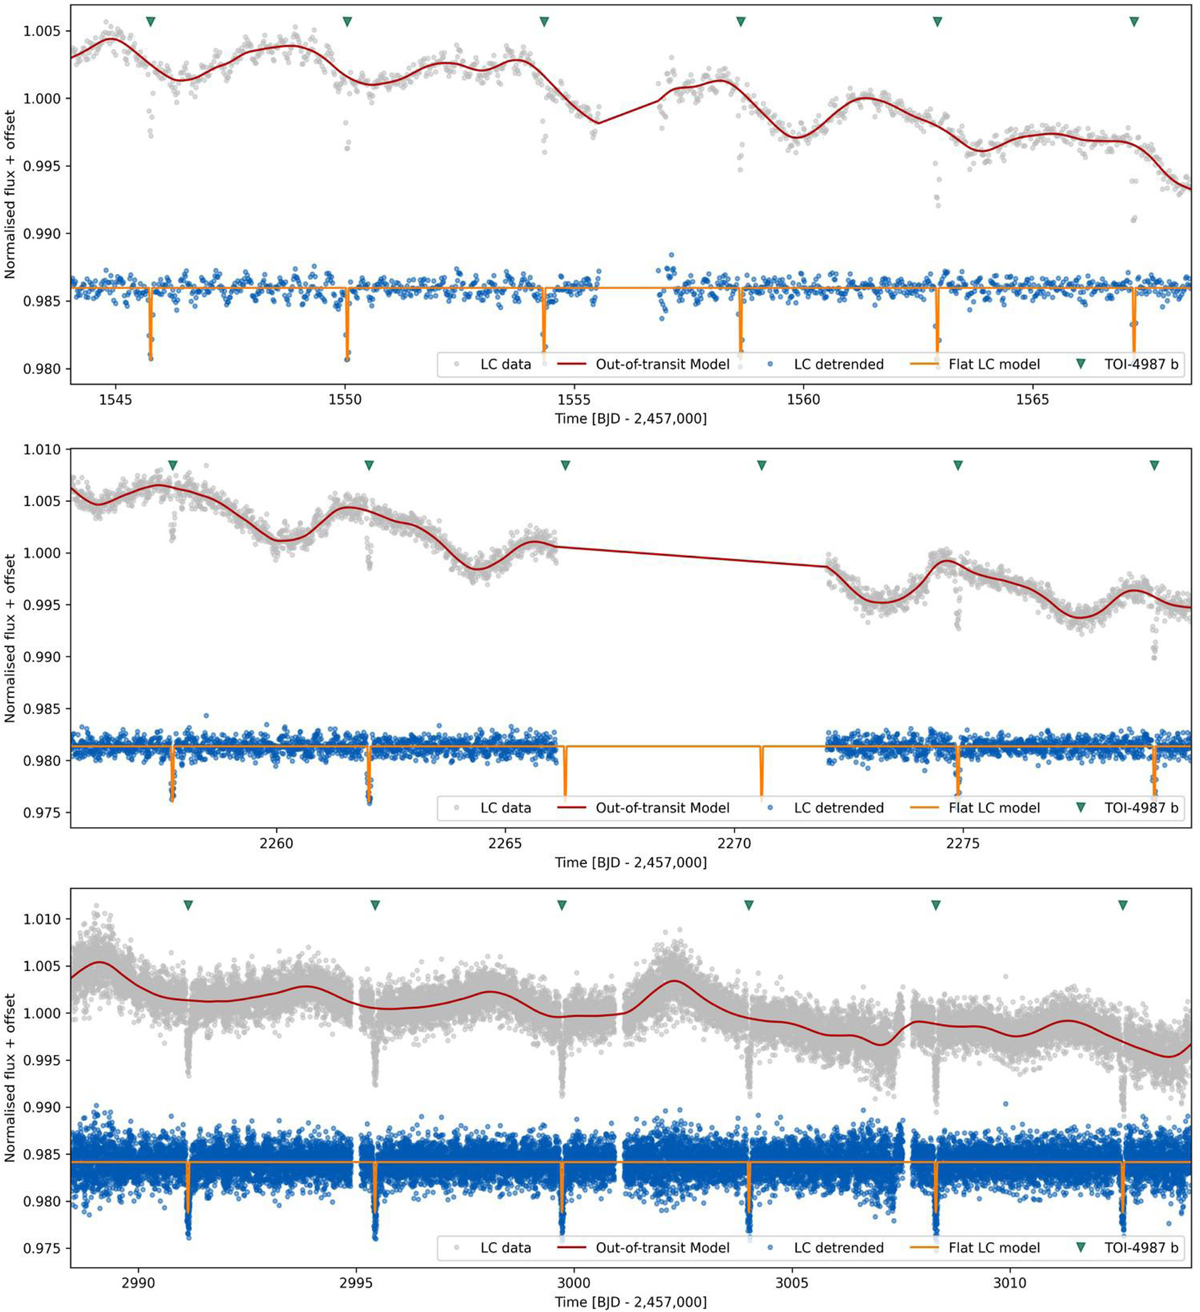
SPOC PDCSAP LCs for BD-14 3065 from TESS sector 9 (top panel), sector 35 (middle panel), and sector 62 (bottom panel). Grey points represent the TESS observations, while red lines correspond to the out-of-transit GP models created with citlalicue to capture the variability in the LCs. Datasets were divided by these models leading to flattened TESS LCs (blue points) with transit models (orange lines). Green triangles indicate the positions of transits. The LCs still show pulsations, but these were later removed.
Current usage metrics show cumulative count of Article Views (full-text article views including HTML views, PDF and ePub downloads, according to the available data) and Abstracts Views on Vision4Press platform.
Data correspond to usage on the plateform after 2015. The current usage metrics is available 48-96 hours after online publication and is updated daily on week days.
Initial download of the metrics may take a while.