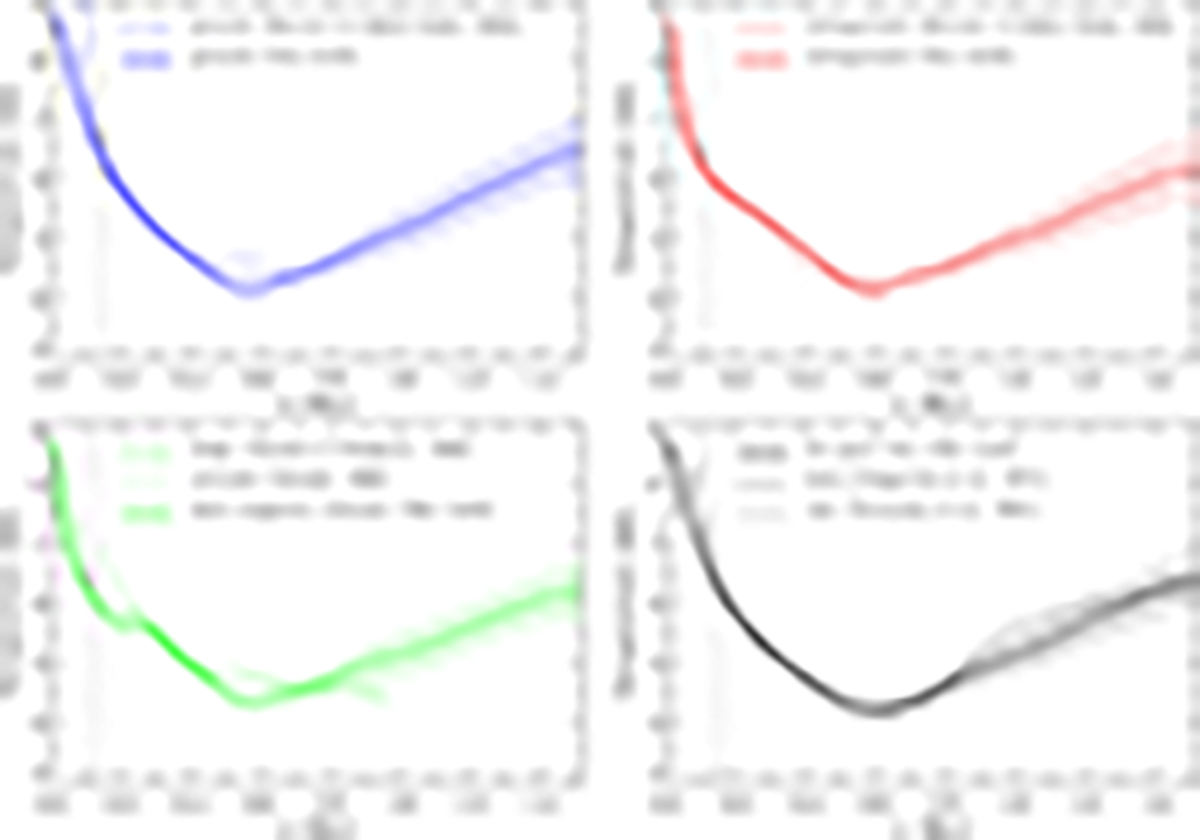
Fig. 10.
Download original image
T(z) corresponding to four models presented in this work: average granule (top left; solid blue), average intergranule (top right; solid red), average dark magnetic elements (bottom left; solid green), and average quiet Sun (bottom right; solid black). Standard deviation from the mean values are indicated by the vertical colored lines. The vertical black dashed lines show the location of the τc = 1 level in each of these models. Dashed and dotted color lines represent well-known, one-dimensional semi-empirical models for similar solar structures. The z scale in these models has been shifted so that the τc = 1 coincides with that of the models introduced in this work.
Current usage metrics show cumulative count of Article Views (full-text article views including HTML views, PDF and ePub downloads, according to the available data) and Abstracts Views on Vision4Press platform.
Data correspond to usage on the plateform after 2015. The current usage metrics is available 48-96 hours after online publication and is updated daily on week days.
Initial download of the metrics may take a while.