Fig. A.1.
Download original image
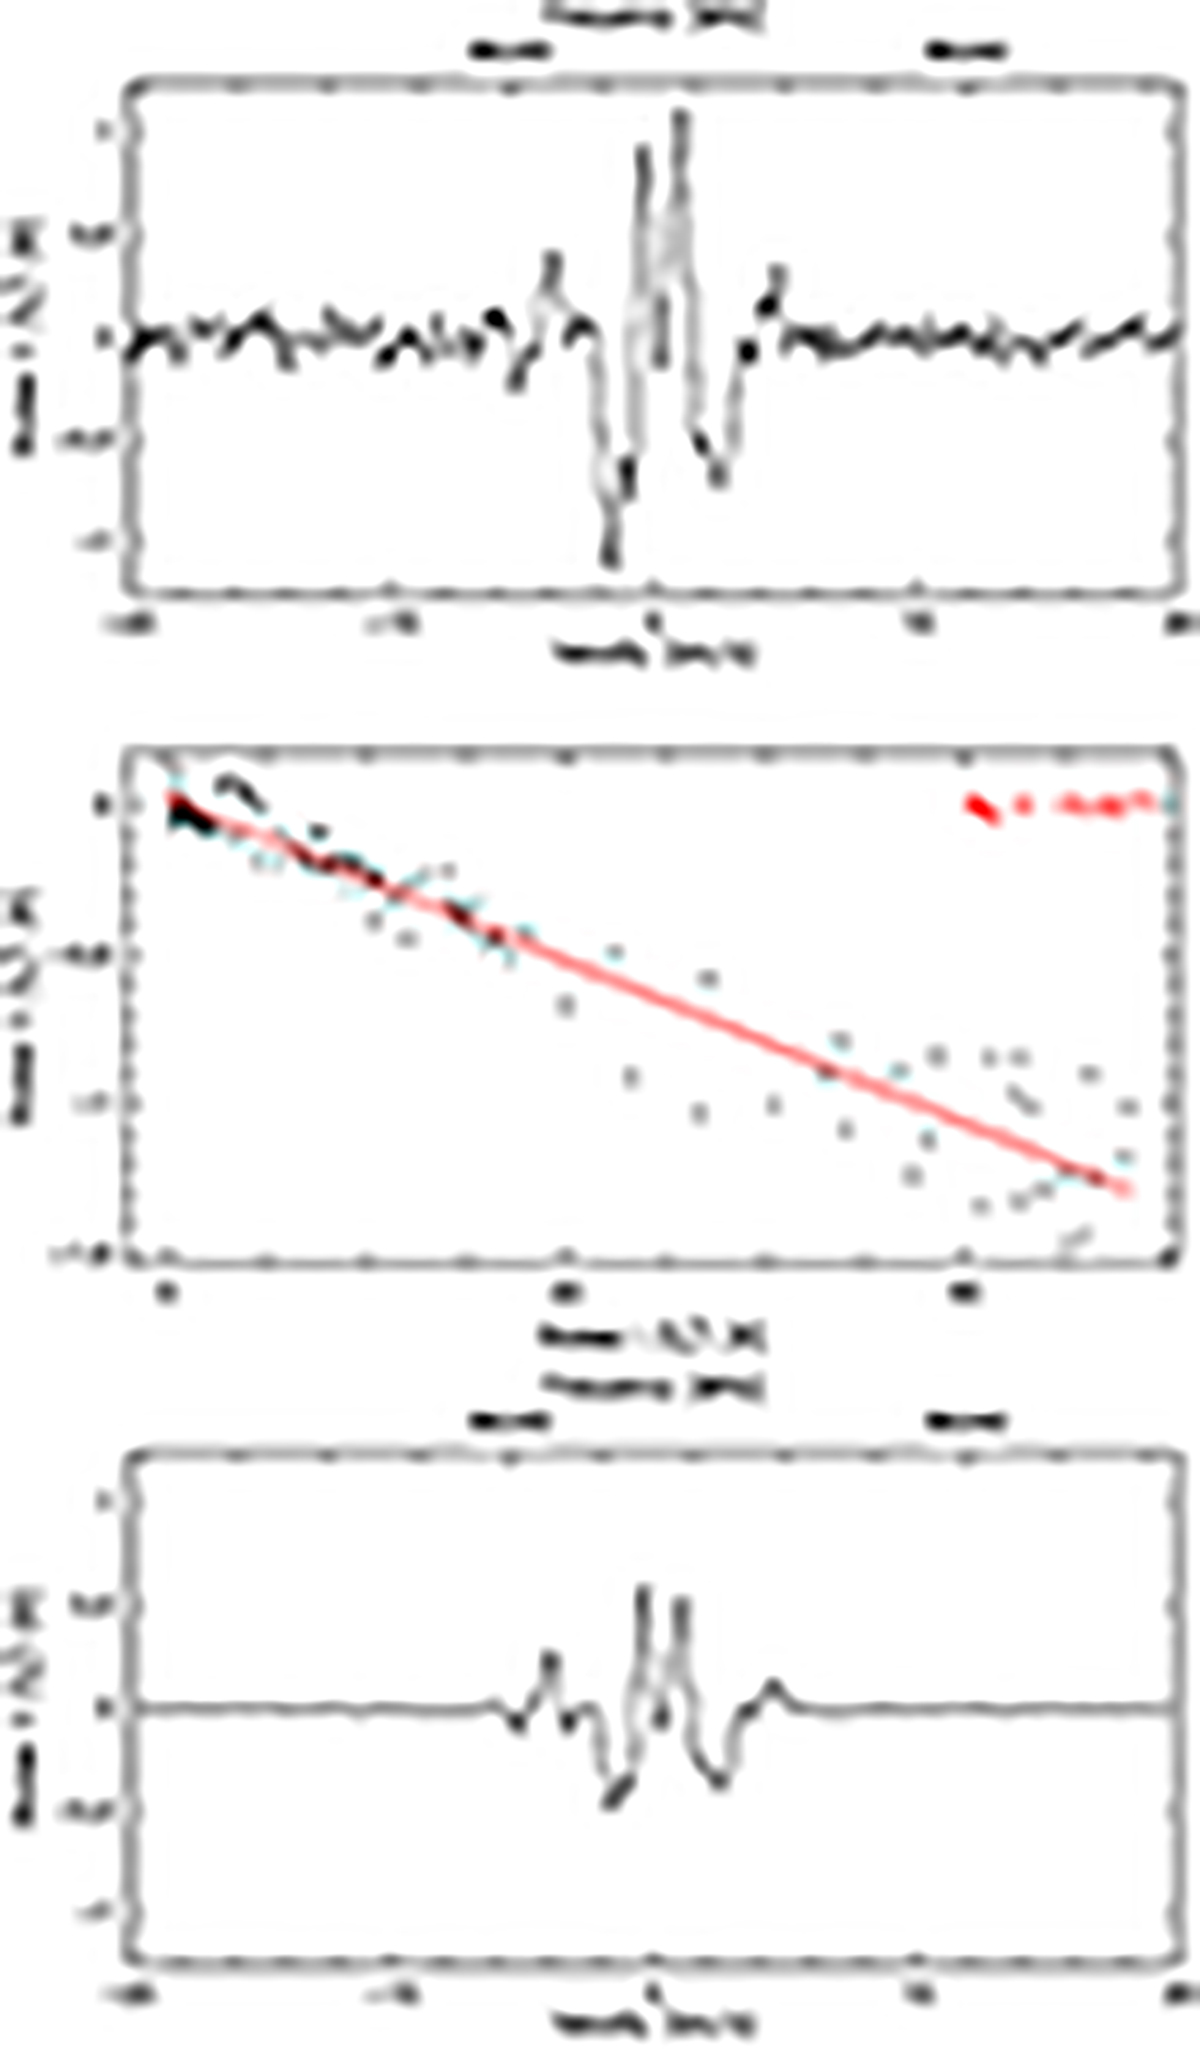
Illustration of our method to remove the instrumental polarization in Stokes V spectra for R Leo. Top: Average of Stokes V spectra with low leakage (|MIV|< 0.01). Center: Example of the correlation between Vinstr = MIV ⋅ I and Stokes I. The regression slope is MIV = −0.0271. Bottom: Final cleaned and averaged Stokes V spectrum. The vertical plot scale is the same as for the spectrum shown above.
Current usage metrics show cumulative count of Article Views (full-text article views including HTML views, PDF and ePub downloads, according to the available data) and Abstracts Views on Vision4Press platform.
Data correspond to usage on the plateform after 2015. The current usage metrics is available 48-96 hours after online publication and is updated daily on week days.
Initial download of the metrics may take a while.