Fig. 2.
Download original image
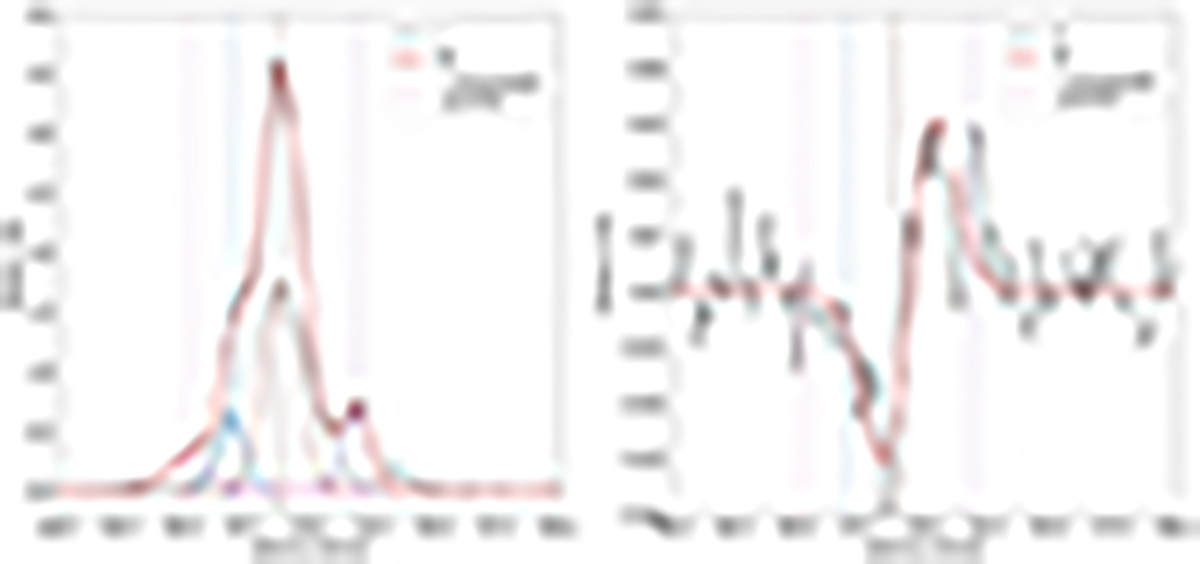
Decomposition of Stokes I and V for R Aql (spectral resolution of 0.139 km s−1). Left: Stokes I data are shown in black, and the global fit is shown in red. The vertical dashed colored lines are the positions of the center of the individual Gaussian functions used in the fit, plotted in various colors. Right: Stokes V data cleaned from instrumental polarization are shown in black (Sect. 3.2), and the fit is shown in red. The vertical dashed colored lines show the individual Gaussian I components from the Stokes I fitting procedure (left panel).
Current usage metrics show cumulative count of Article Views (full-text article views including HTML views, PDF and ePub downloads, according to the available data) and Abstracts Views on Vision4Press platform.
Data correspond to usage on the plateform after 2015. The current usage metrics is available 48-96 hours after online publication and is updated daily on week days.
Initial download of the metrics may take a while.