Fig. 8.

Download original image
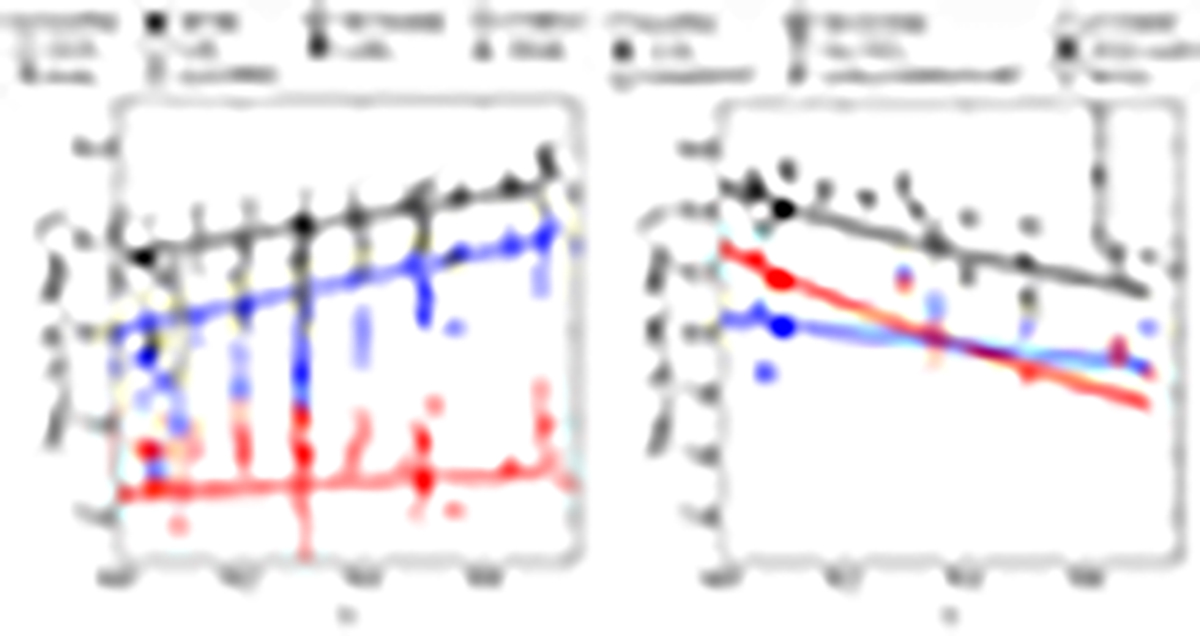
Cosmic evolution of the B-band luminosity and stellar mass densities (left and right panels, respectively) for quiescent, star-forming, and full miniJPAS samples (red, blue, and black lines, respectively). The shaded areas illustrate the uncertainties of these densities. Left panel: B-band absolute magnitude densities from 2dFGRS (cross markers, Madgwick et al. 2002), 2MASS/SDSS (star markers, Bell et al. 2003), COMBO-17/DEEP2 (squares and diamonds, respectively; Faber et al. 2007), AGES (pentagons, Cool et al. 2012), GAMA (plus marker, Loveday et al. 2012), VIPERS (triangle up, Fritz et al. 2014), Boötes field (triangle left, Beare et al. 2015), and ALHAMBRA (circle, López-Sanjuan et al. 2017) surveys are included for comparison. Right panel: stellar mass densities from 2MASS/SDSS (star markers, Bell et al. 2003), S-COSMOS (circles, Ilbert et al. 2010), GAMA (plus markers, Baldry et al. 2012), UltraVISTA (squares, Ilbert et al. 2013), SDSS/GALEX (crosses, Moustakas et al. 2013), COSMOS2015 (diamonds, Davidzon et al. 2017), GAMA/G10-COSMOS/3D-HST (triangle right, Wright et al. 2018), and DEVILS (hexagons, Thorne et al. 2021).
Current usage metrics show cumulative count of Article Views (full-text article views including HTML views, PDF and ePub downloads, according to the available data) and Abstracts Views on Vision4Press platform.
Data correspond to usage on the plateform after 2015. The current usage metrics is available 48-96 hours after online publication and is updated daily on week days.
Initial download of the metrics may take a while.


