Fig. 6.
Download original image
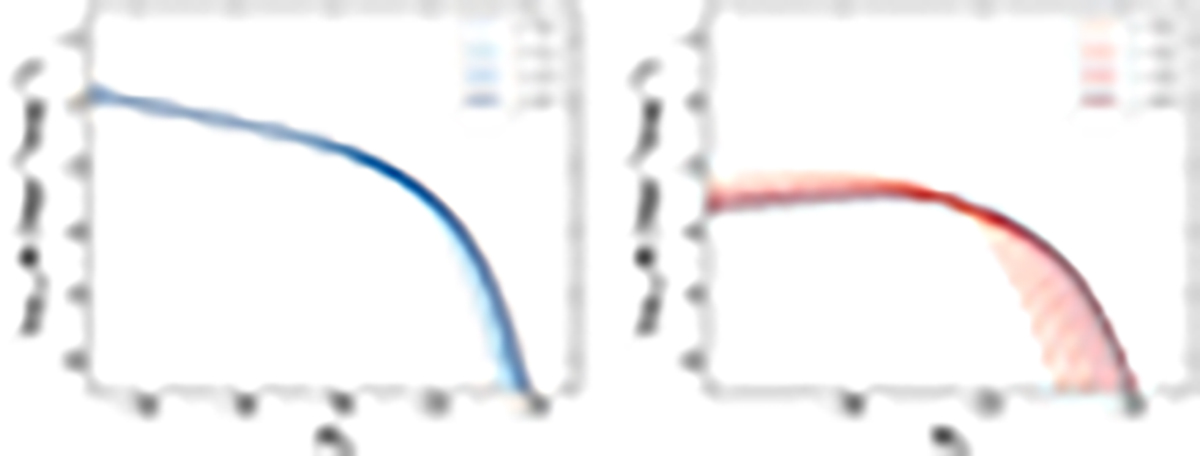
Evolution with redshift of the B-band luminosity functions of star-forming and quiescent galaxies (solid lines in left and right panels, respectively) from miniJPAS. The shaded areas exhibit the uncertainties in the luminosity functions obtained with our methodology. The dash-dot lines show the B-band luminosity functions before correcting of Eddington bias effects. The dashed and dotted lines point the absolute magnitude range in which our sample is affected by incompleteness after and before correcting for Eddington bias effects, respectively.
Current usage metrics show cumulative count of Article Views (full-text article views including HTML views, PDF and ePub downloads, according to the available data) and Abstracts Views on Vision4Press platform.
Data correspond to usage on the plateform after 2015. The current usage metrics is available 48-96 hours after online publication and is updated daily on week days.
Initial download of the metrics may take a while.