Fig. 3.
Download original image
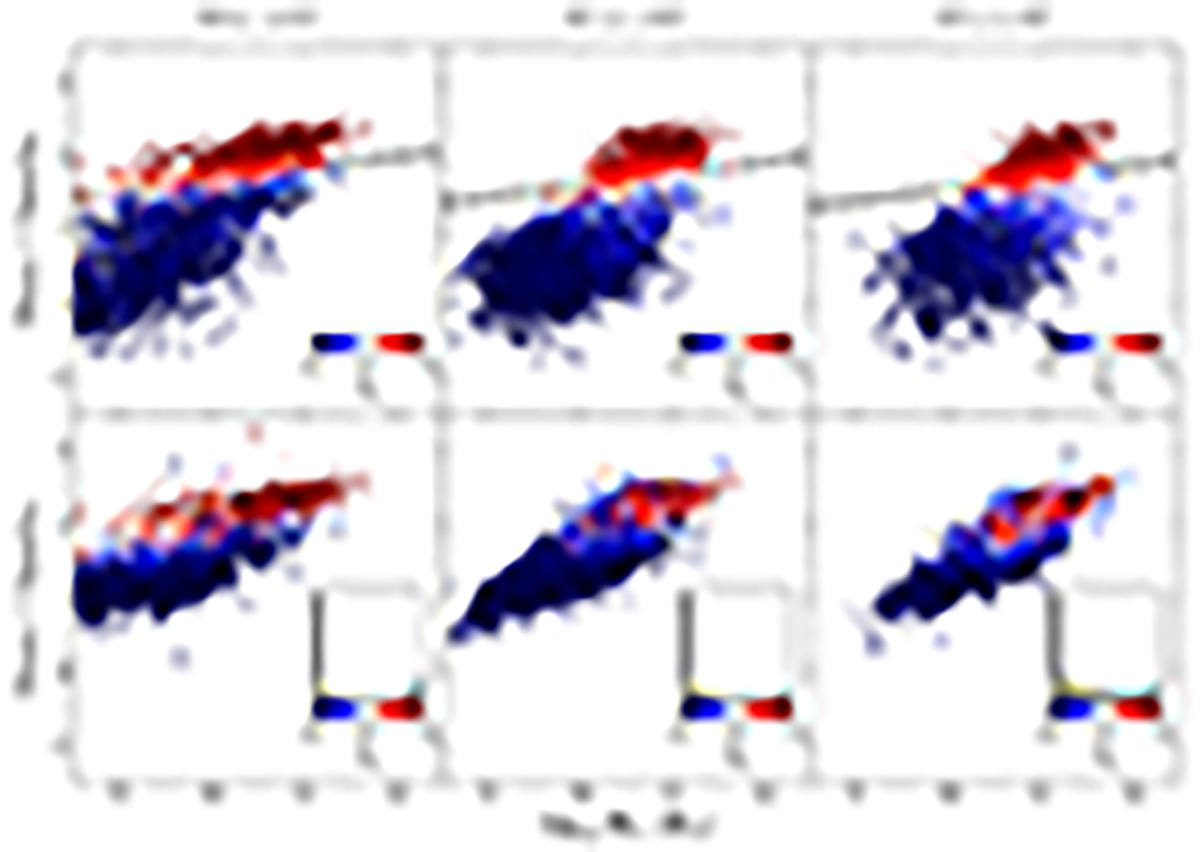
Distribution of stellar mass versus rest-frame colour (uJAVA − rSDSS) obtained from miniJPAS sources with rSDSS ≤ 22.5 and PG ≥ 0.5 at different redshift bins. Top: diagram of the (uJAVA − rSDSS) colour after correcting for dust effects or intrinsic colour. Bottom: diagrams without correcting the rest-frame (uJAVA − rSDSS) colour for extinction and normalised histograms of PQ values for each redshift bin (see insets). The dashed black line illustrates the limiting relation for selecting quiescent galaxies and AUTO photometry at the central redshift of each bin (i.e. z = 0.15, 0.4, and 0.6; see Eq. (1)). Dots are colour coded according to the quiescent and star-forming classification (redder and bluer colours, respectively) or quiescent probability (PQ).
Current usage metrics show cumulative count of Article Views (full-text article views including HTML views, PDF and ePub downloads, according to the available data) and Abstracts Views on Vision4Press platform.
Data correspond to usage on the plateform after 2015. The current usage metrics is available 48-96 hours after online publication and is updated daily on week days.
Initial download of the metrics may take a while.