Fig. 2.
Download original image
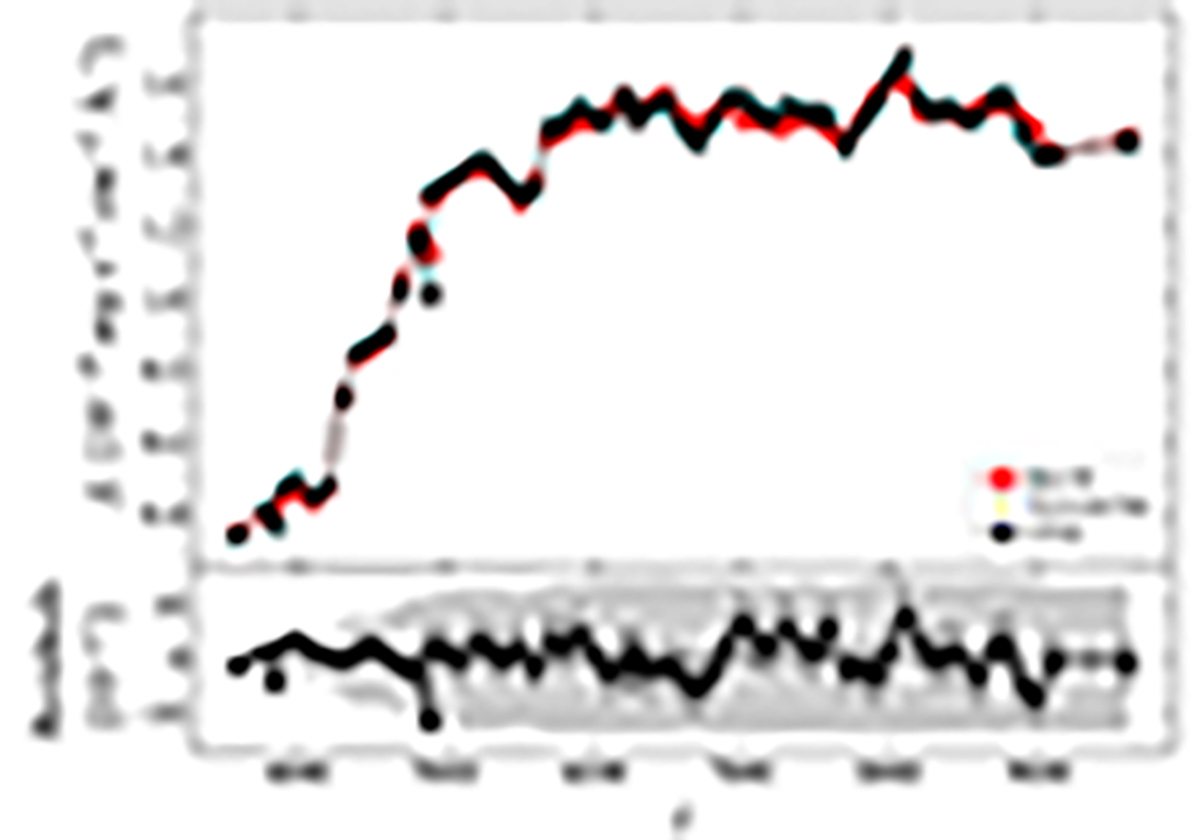
SED-fitting analysis (top panel) and residuals (bottom panel) of a miniJPAS galaxy at z = 0.07 (ID 2470-10239). The black dots and vertical bars in the top panel are the galaxy fluxes and errors as observed by miniJPAS, respectively. The red squares are the best-fitting CSP model. The shaded area shows 2.5 times the photon-noise uncertainty of each band.
Current usage metrics show cumulative count of Article Views (full-text article views including HTML views, PDF and ePub downloads, according to the available data) and Abstracts Views on Vision4Press platform.
Data correspond to usage on the plateform after 2015. The current usage metrics is available 48-96 hours after online publication and is updated daily on week days.
Initial download of the metrics may take a while.