Fig. 7.
Download original image
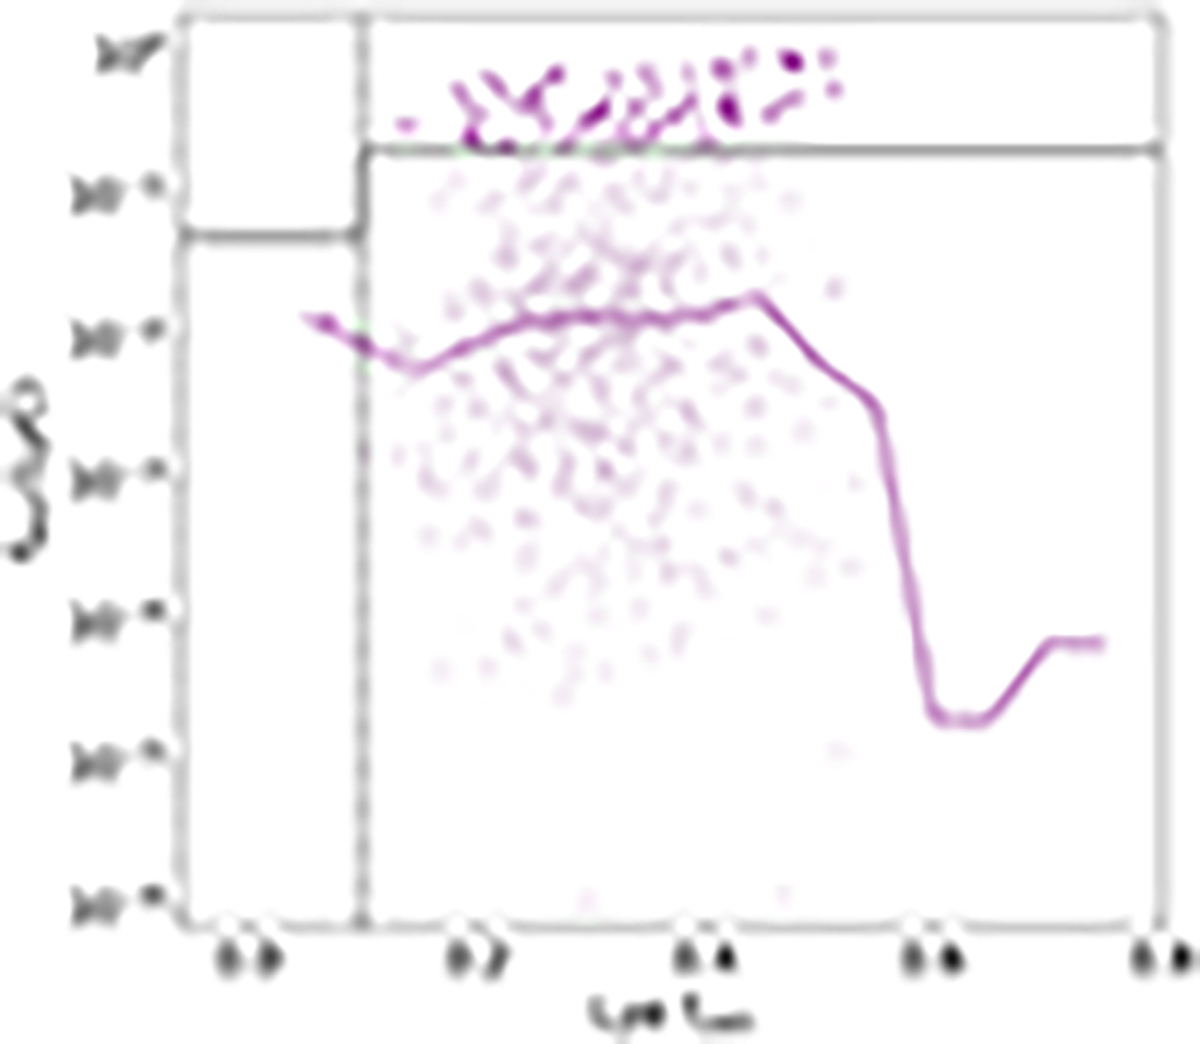
Comparison of our data with the central flux fraction method derived by Naidu et al. (2022). The dashed black line here is the divide between leakers and non-leakers. The points in purple are the points from our sample that fit these criteria and the points in pastel are those that do not. We also show the running median of our sample here with the solid purple line.
Current usage metrics show cumulative count of Article Views (full-text article views including HTML views, PDF and ePub downloads, according to the available data) and Abstracts Views on Vision4Press platform.
Data correspond to usage on the plateform after 2015. The current usage metrics is available 48-96 hours after online publication and is updated daily on week days.
Initial download of the metrics may take a while.