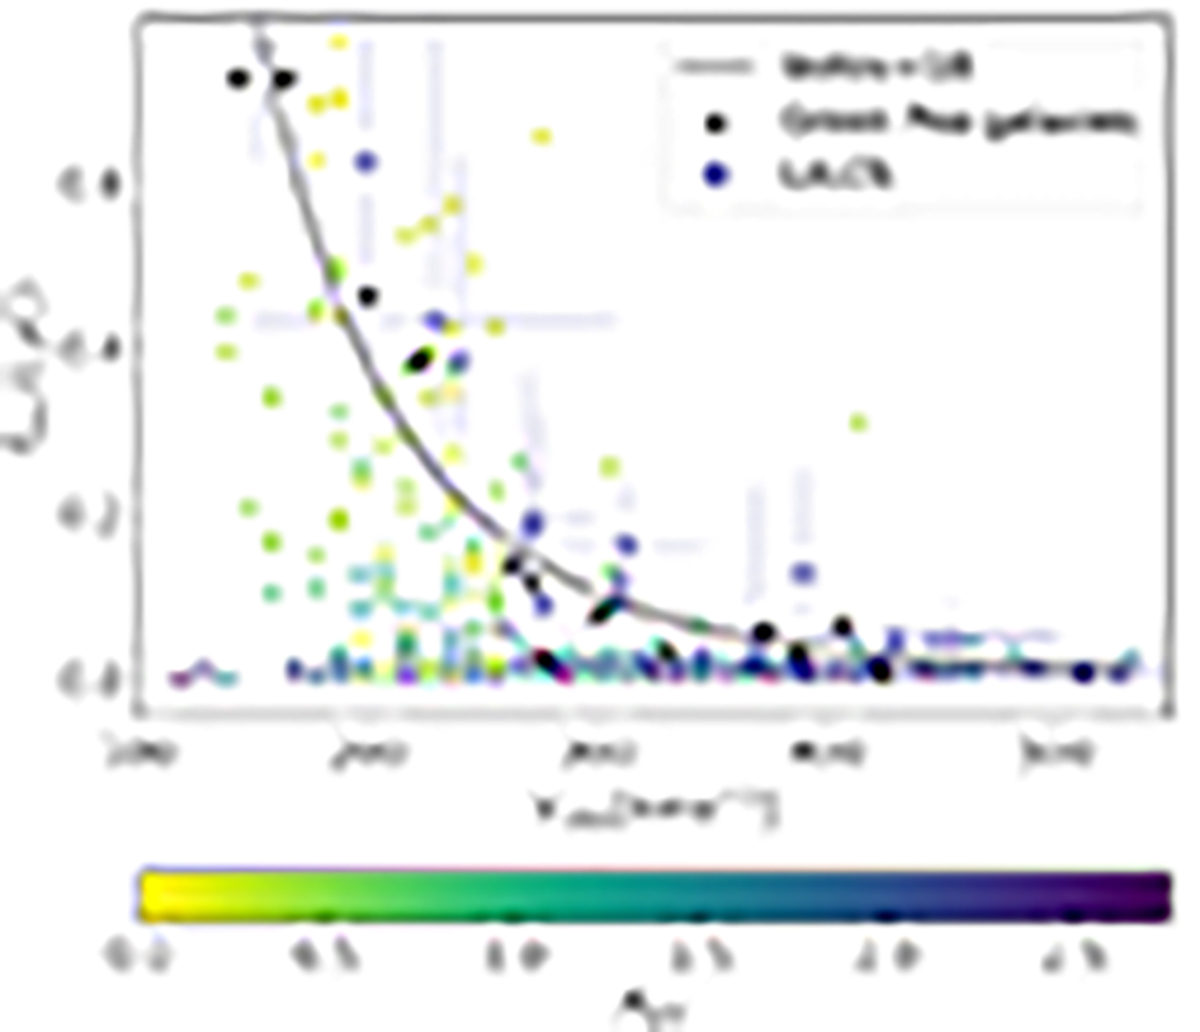
Fig. 6.
Download original image
Comparison of our data, color-coded by the dust attenuation in the UV of each line of sight, with the relation found by Izotov et al. (2018b), shown with the black line. The Green Pea galaxies that the relation was calibrated on are shown with black stars. The more recent measurements of peak separations of low-redshift galaxies by Flury et al. (2022b) are shown with empty blue squares.
Current usage metrics show cumulative count of Article Views (full-text article views including HTML views, PDF and ePub downloads, according to the available data) and Abstracts Views on Vision4Press platform.
Data correspond to usage on the plateform after 2015. The current usage metrics is available 48-96 hours after online publication and is updated daily on week days.
Initial download of the metrics may take a while.