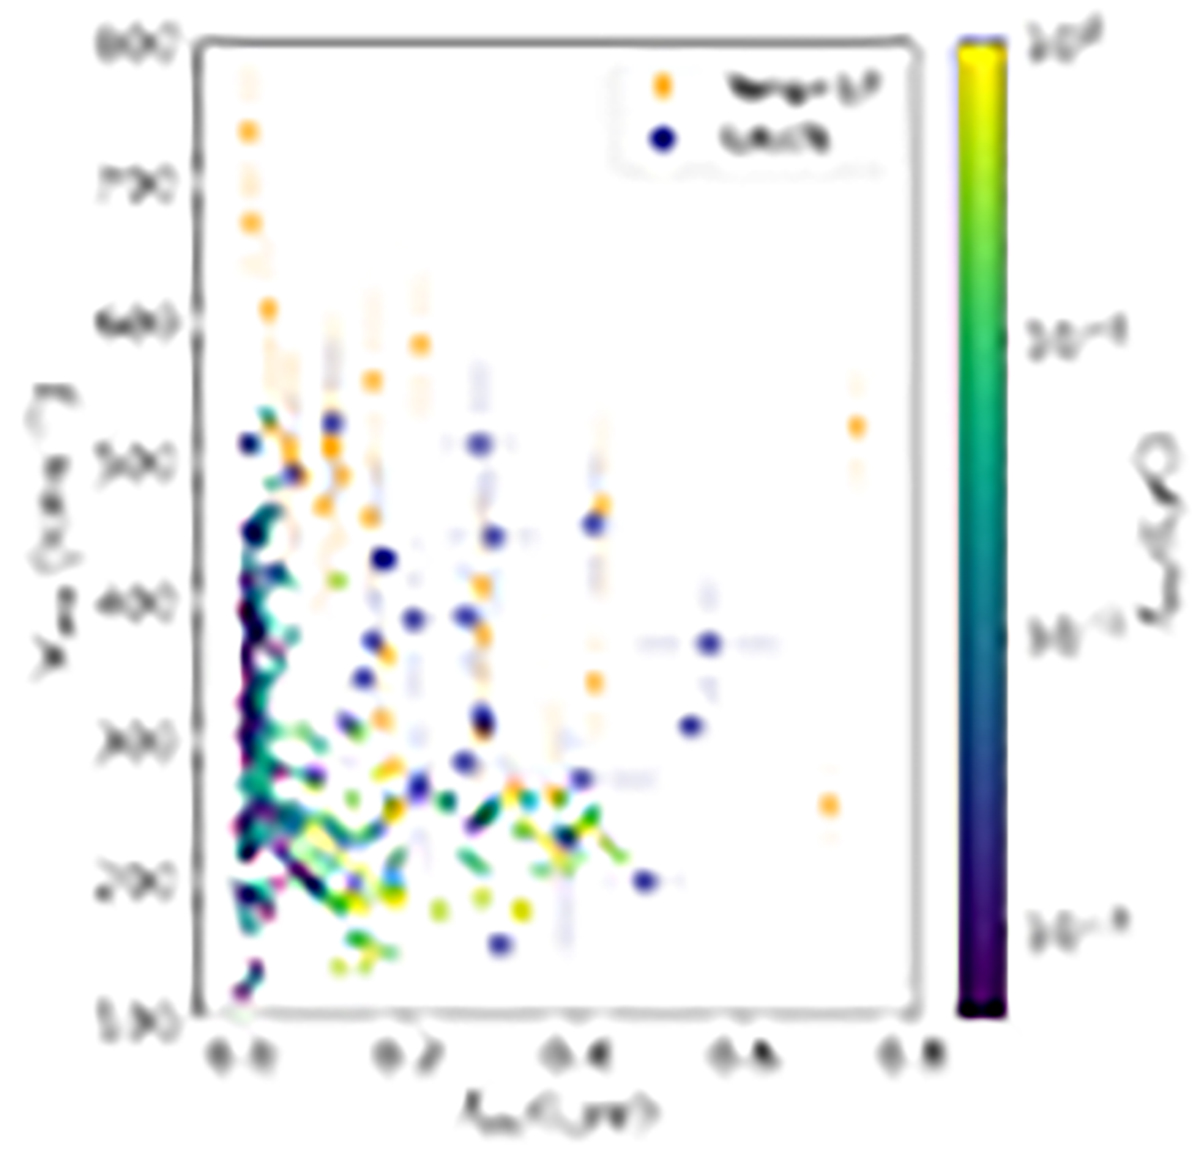
Fig. 4.
Download original image
Lyman-α peak separation against Lyman-α escape fraction, color-coded by the LyC escape fraction. We also show observational data from Yang et al. (2017) in the orange triangles and Flury et al. (2022b) in the blue squares. Here, we are showing that although spectra with large peak separations (above 300 km s−1) always have low LyC and Lyman-α escape fractions, the contrary is not true, as we have many lines of sight with both low peak separation and escape fractions.
Current usage metrics show cumulative count of Article Views (full-text article views including HTML views, PDF and ePub downloads, according to the available data) and Abstracts Views on Vision4Press platform.
Data correspond to usage on the plateform after 2015. The current usage metrics is available 48-96 hours after online publication and is updated daily on week days.
Initial download of the metrics may take a while.