Fig. 6.
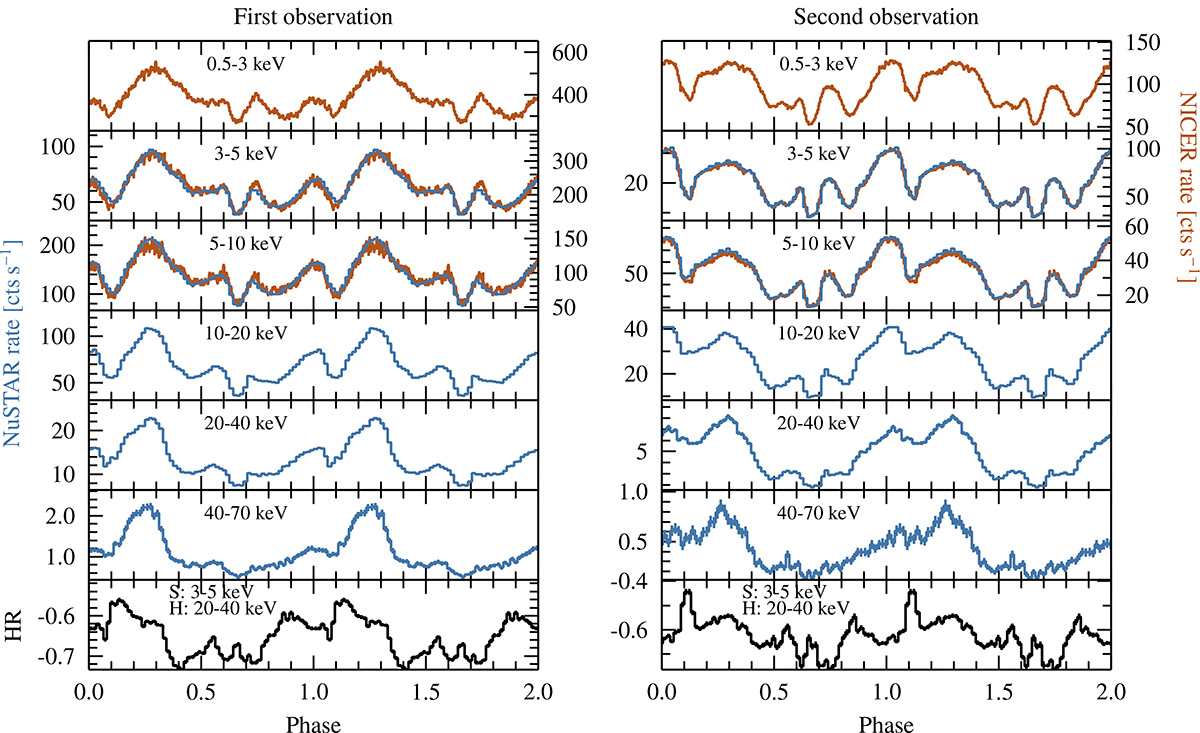
Download original image
Pulse profiles in different energy bands for both NICER in blue and NuSTAR in red. The left plot shows the first NuSTAR observation and the concurrent NICER pointing, while the right plot shows the second NuSTAR observation and its concurrent NICER pointing. The hardness ratio in the lowest panel is calculated from NuSTAR data as (H + S)/(H − S), with the two energy bands S: 3−5 keV and H: 20−40 keV.
Current usage metrics show cumulative count of Article Views (full-text article views including HTML views, PDF and ePub downloads, according to the available data) and Abstracts Views on Vision4Press platform.
Data correspond to usage on the plateform after 2015. The current usage metrics is available 48-96 hours after online publication and is updated daily on week days.
Initial download of the metrics may take a while.