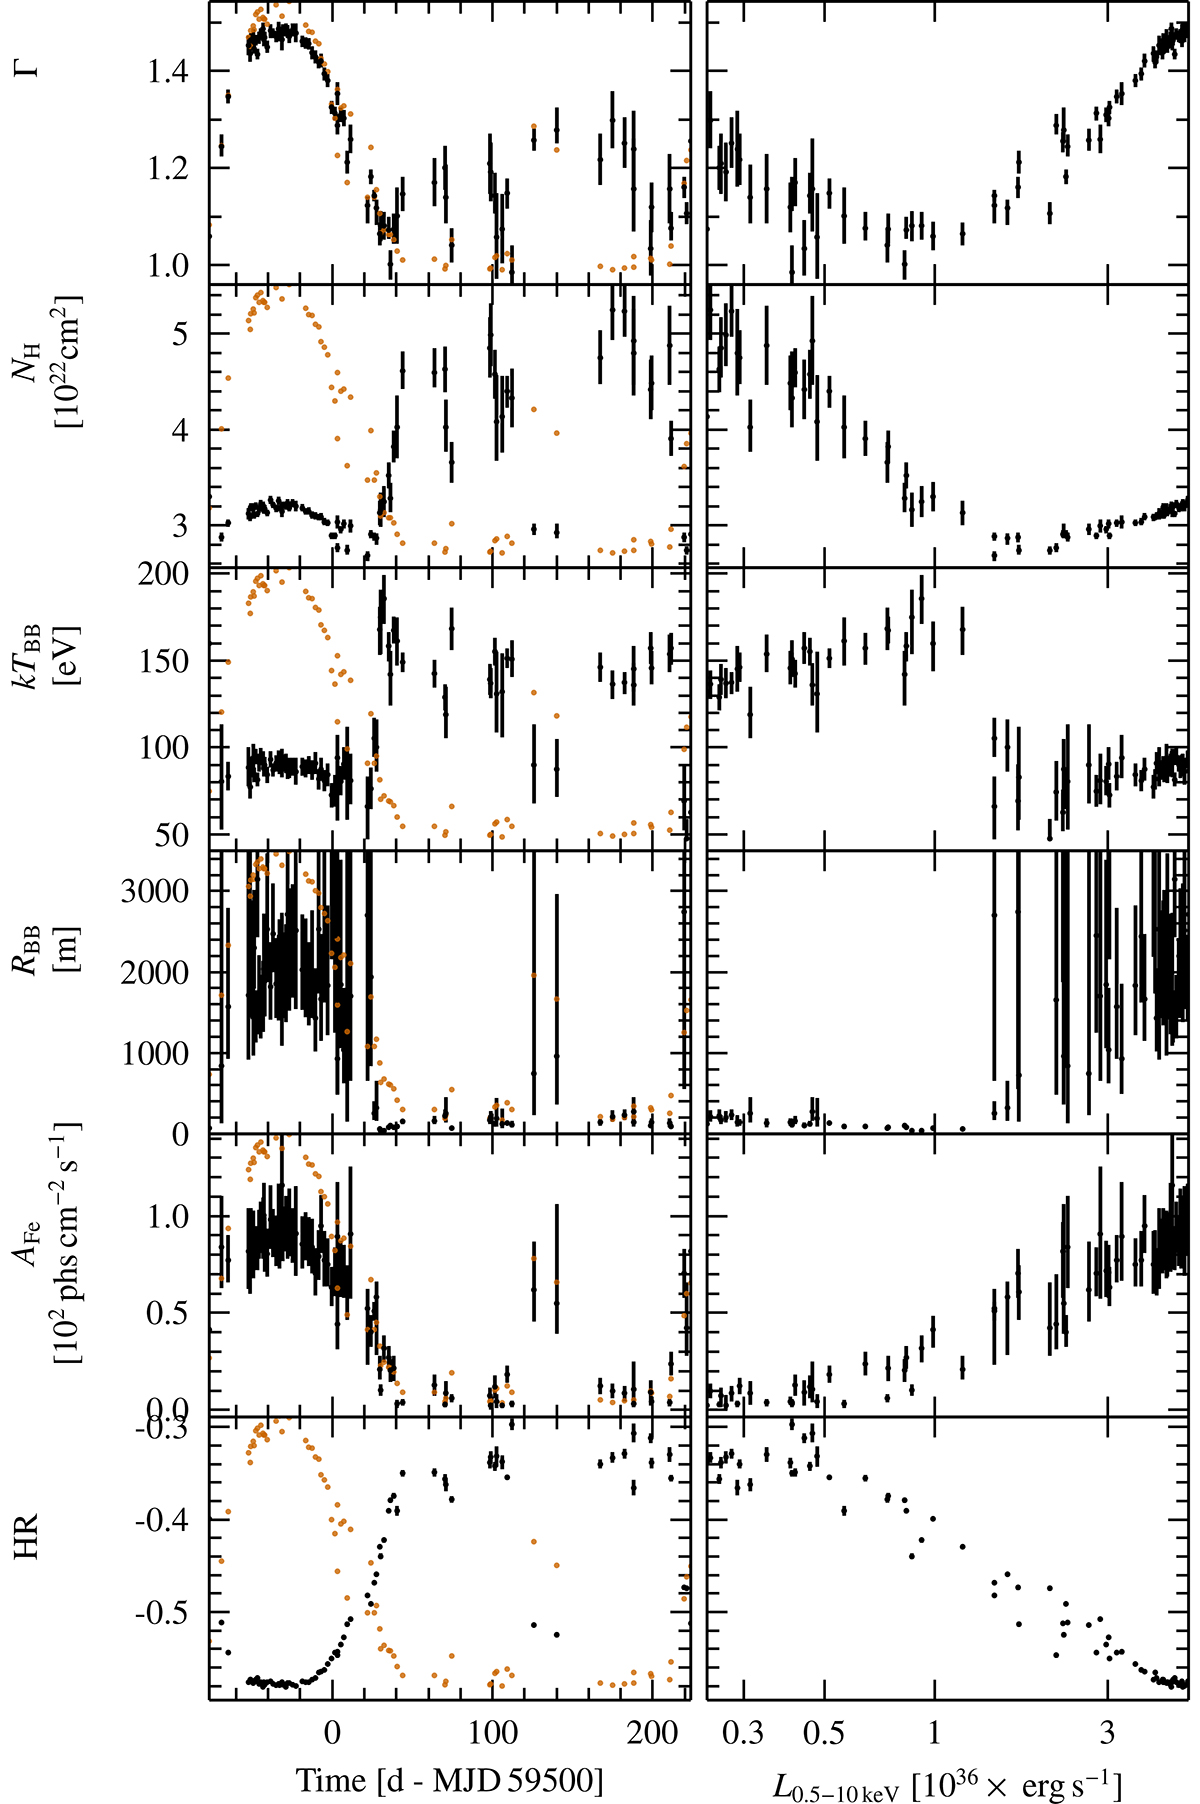
Fig. 4.
Download original image
Evolution of the 0.5−10 keV flux, hardness, and main spectral parameters over the course of the 2021 outburst. The left panel shows the evolution over time and the right panel shows how these parameters depend on luminosity. The orange data points in the left panel represent the light curve over the course of the outburst. The hardness is defined as (H − S)/(H + S) where H is the count rate in the 0.5−2 keV band and where S is the count rate in the 2−10 keV band. Each point corresponds to one observation.
Current usage metrics show cumulative count of Article Views (full-text article views including HTML views, PDF and ePub downloads, according to the available data) and Abstracts Views on Vision4Press platform.
Data correspond to usage on the plateform after 2015. The current usage metrics is available 48-96 hours after online publication and is updated daily on week days.
Initial download of the metrics may take a while.