Fig. 3.
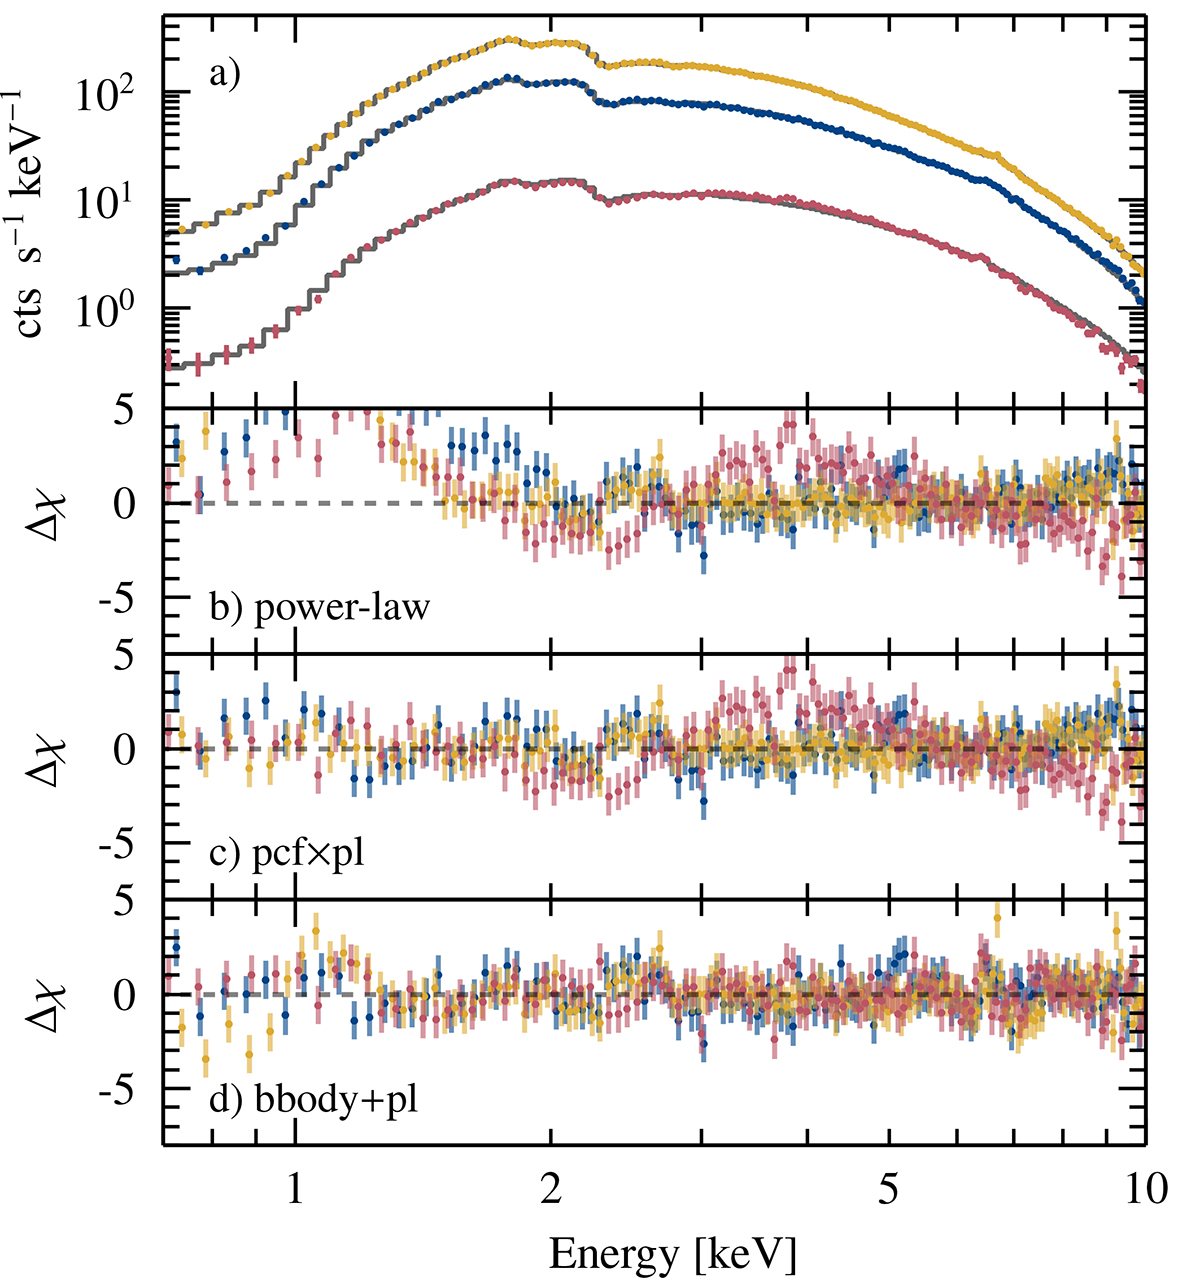
Download original image
Spectrum of the rise (ObsID 4201960102), peak (ObsID 4201960113), and decline (ObsID 4201960150) of the outburst of EXO 2030+375 and their best fit with the bbody+pl model in blue, yellow, and red respectively. The lower panels show the residuals for fits with an absorbed power law with an iron Kα line emission and with an additional black body or partial covering component.
Current usage metrics show cumulative count of Article Views (full-text article views including HTML views, PDF and ePub downloads, according to the available data) and Abstracts Views on Vision4Press platform.
Data correspond to usage on the plateform after 2015. The current usage metrics is available 48-96 hours after online publication and is updated daily on week days.
Initial download of the metrics may take a while.