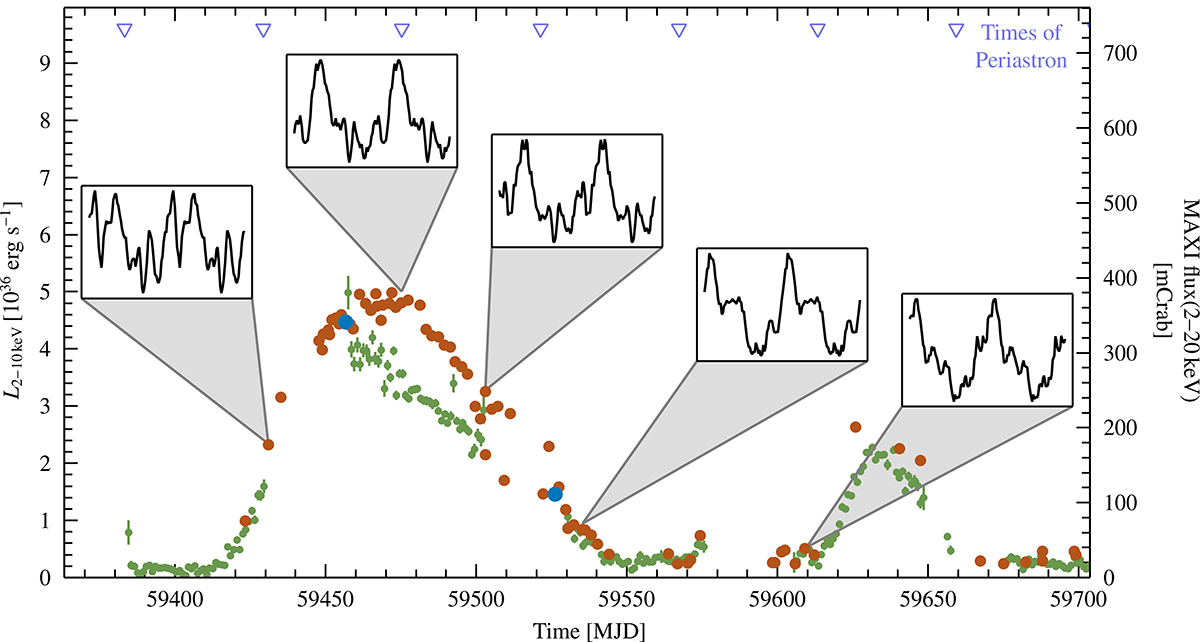
Fig. 2.
Download original image
Light curve of the outburst as seen by NICER with each point corresponding to one observation. The luminosity of each observation is derived from the spectral fits described in Sect. 3. The daily MAXI light-curve of the same period is shown in green. Observations with quasi-simultaneous NuSTAR points are marked in blue. Overlaid are five of the pulse profiles at different times over the outburst. The purple markers at the top indicate the times of periastron passage using the orbital solution by Wilson et al. (2002).
Current usage metrics show cumulative count of Article Views (full-text article views including HTML views, PDF and ePub downloads, according to the available data) and Abstracts Views on Vision4Press platform.
Data correspond to usage on the plateform after 2015. The current usage metrics is available 48-96 hours after online publication and is updated daily on week days.
Initial download of the metrics may take a while.