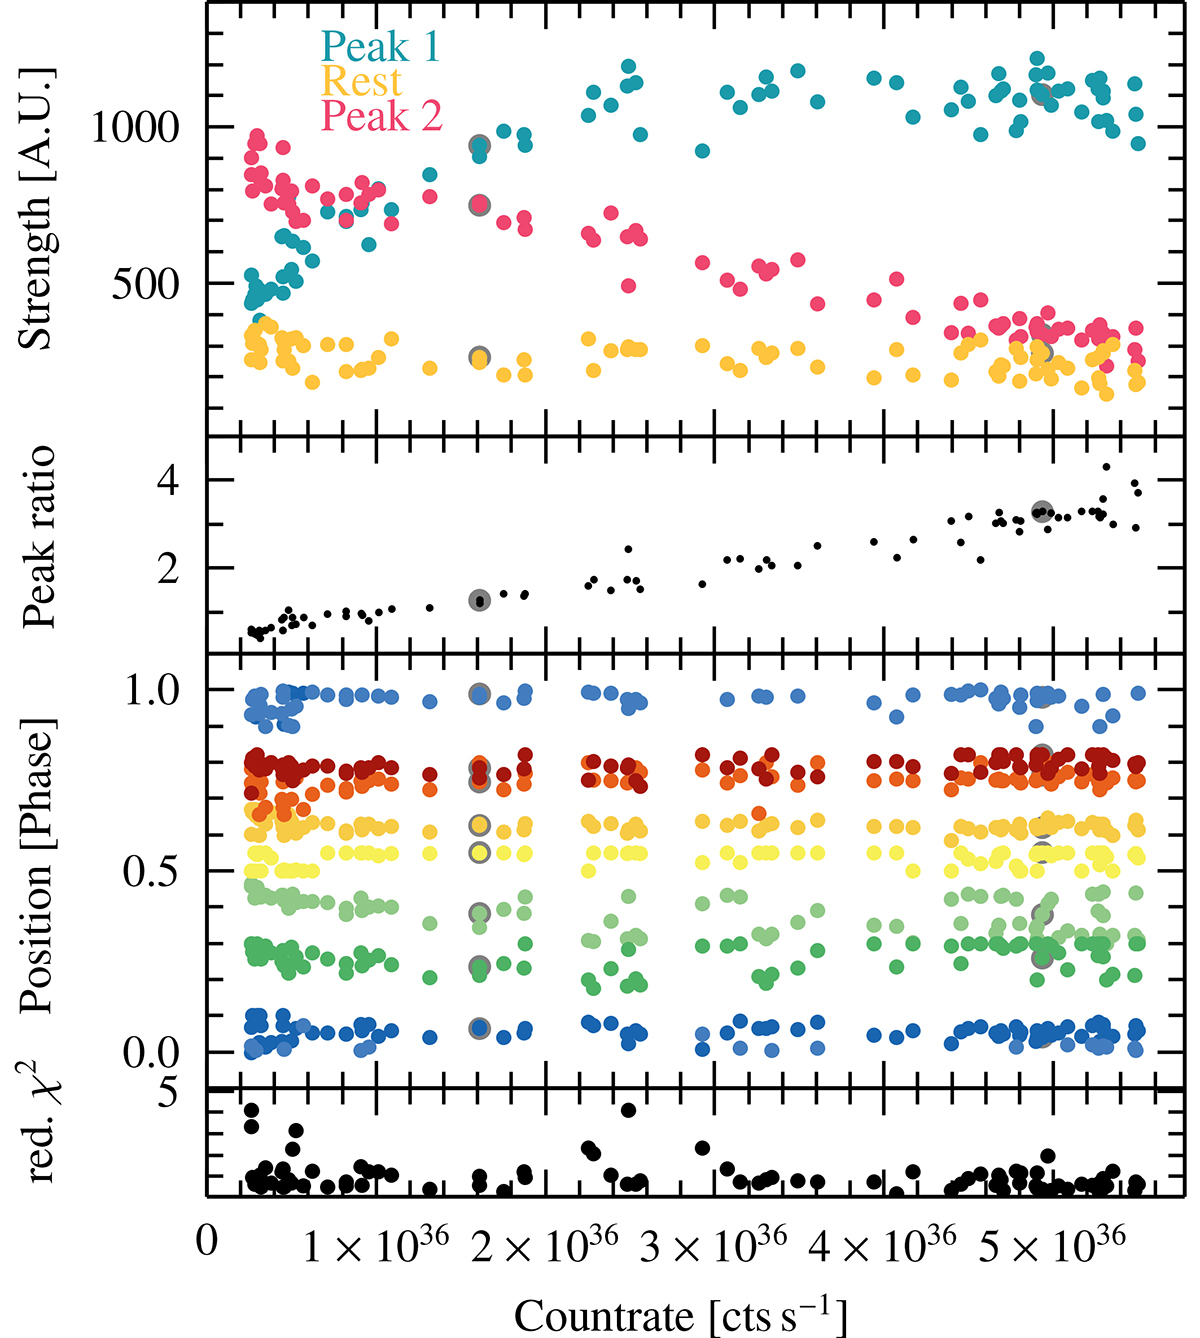
Fig. 15.
Download original image
Results of fitting Gaussians to the NICER pulse profiles. Top: strength of the two main peaks (red and blue) and secondary features (yellow). The first peak is defined as the sum of the first and last Gaussian, the second one as the second and third Gaussian. All other Gaussians are summed as secondary features. Middle: ratio between the strength of the secondary and primary peak. Bottom: position of all fitted Gaussians. The two observations with ObsID 4201960113 and 4201960150, selected also for Fig. 14, are marked by larger gray rings.
Current usage metrics show cumulative count of Article Views (full-text article views including HTML views, PDF and ePub downloads, according to the available data) and Abstracts Views on Vision4Press platform.
Data correspond to usage on the plateform after 2015. The current usage metrics is available 48-96 hours after online publication and is updated daily on week days.
Initial download of the metrics may take a while.