Fig. 1.
Download original image
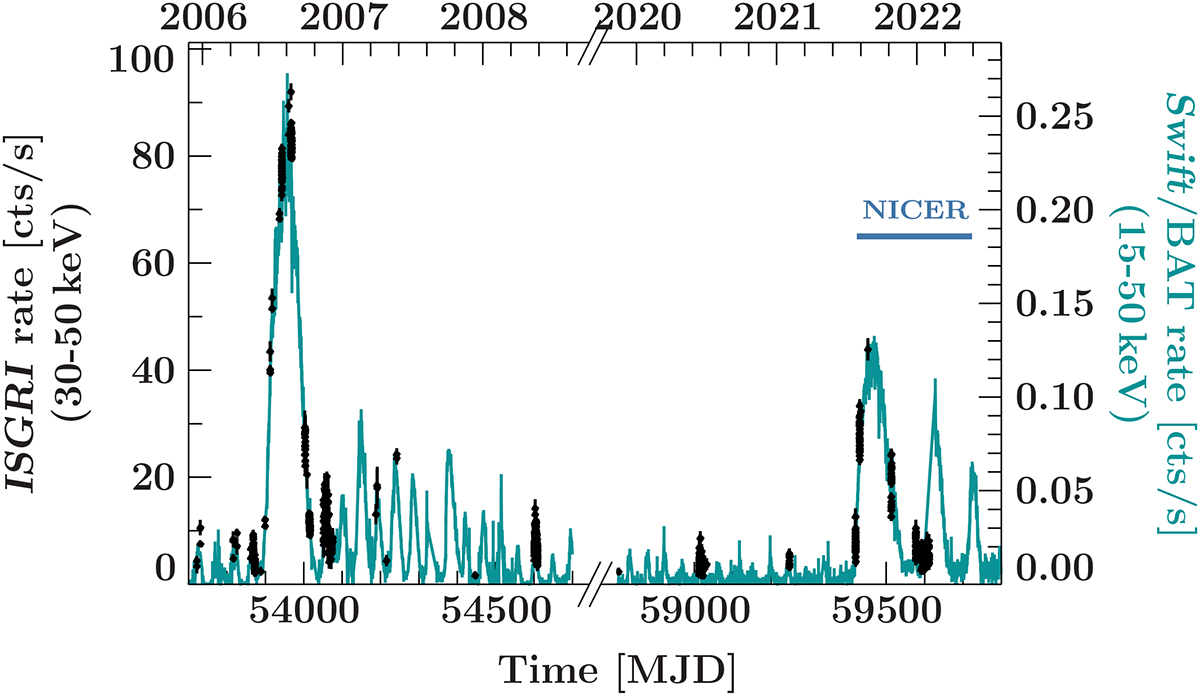
Long-term light curve of EXO 2030+375 in the 30−50 keV band as seen with INTEGRAL in black and the Swift-BAT light curve in teal. For comparison, time ranges around the two most recent Type II outbursts are shown. INTEGRAL data were binned by Science Window, while for Swift-BAT the daily light curve was used. Marked by a horizontal bar is also the time range covered by the NICER monitoring used in this work. See Fig. 2 for the NICER light curve of the 2021 outburst.
Current usage metrics show cumulative count of Article Views (full-text article views including HTML views, PDF and ePub downloads, according to the available data) and Abstracts Views on Vision4Press platform.
Data correspond to usage on the plateform after 2015. The current usage metrics is available 48-96 hours after online publication and is updated daily on week days.
Initial download of the metrics may take a while.