Fig. A.2
Download original image
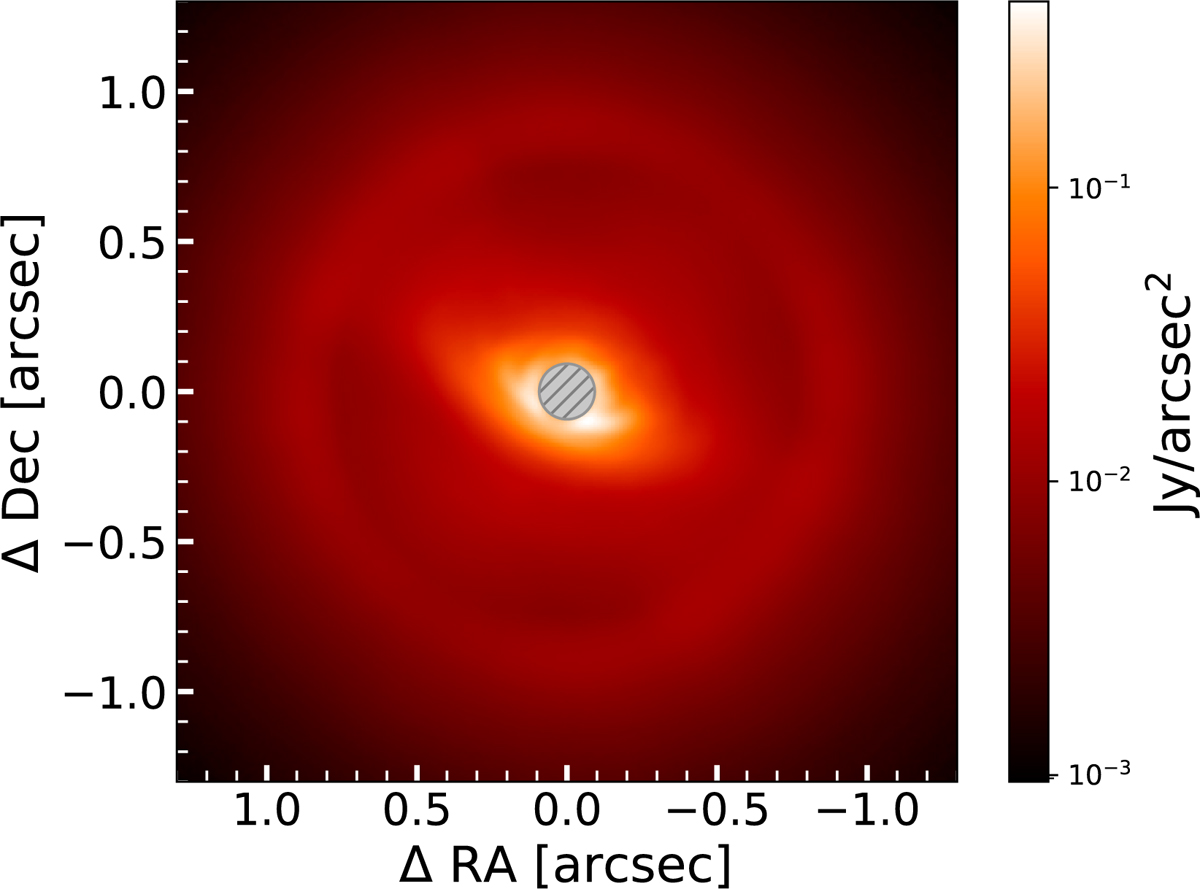
Flux calibrated stacked total intensity image. We note that in this image the stellar light was not removed. The bright ring visible on the outer edge of the image shows the adaptive optics correction radius which shows bright stellar speckle signal (smoothed out by the field rotation during observations). The signal of the disk is faintly visible close to the coronagraph. The image is shown on a (logarithmic) scale, symmetric around 0. The grey, hashed circle in the center marks the area that was covered by a coronagraphie mask.
Current usage metrics show cumulative count of Article Views (full-text article views including HTML views, PDF and ePub downloads, according to the available data) and Abstracts Views on Vision4Press platform.
Data correspond to usage on the plateform after 2015. The current usage metrics is available 48-96 hours after online publication and is updated daily on week days.
Initial download of the metrics may take a while.