Fig. 11
Download original image
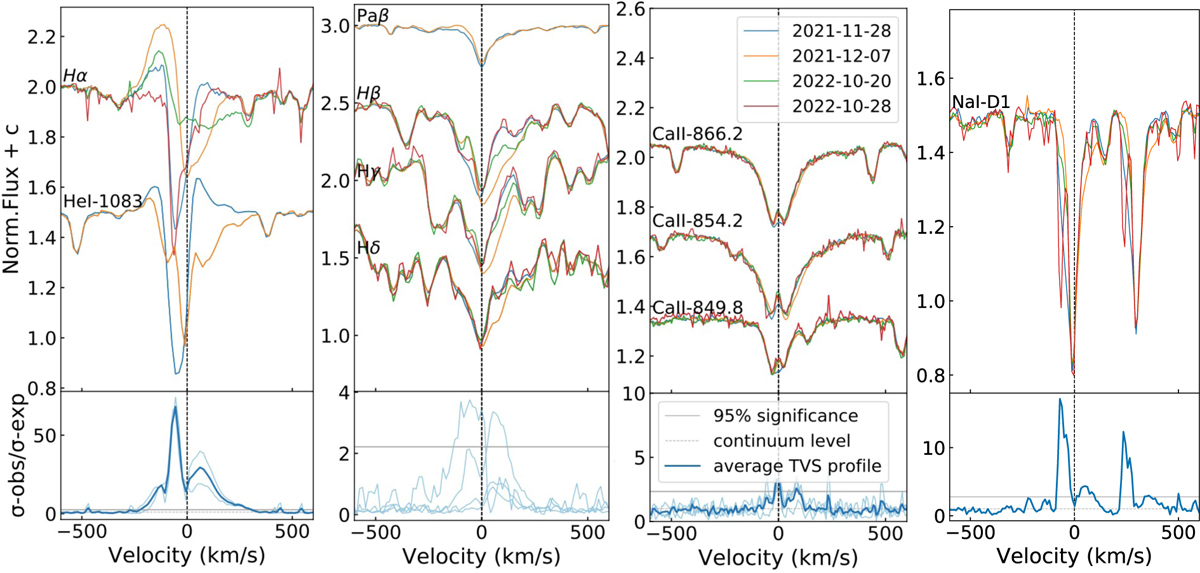
Variable lines in PDS 111. From left to right: Hα and He I λ 1083.0 nm lines in the spectra of PDS 111 are shown on velocity scale in the upper panel. They show significant variations. This is quantified in the lower panel by the use of the temporal variance spectrum, showing the significant variable velocity regime and similarity in the amplitude of the variation. The second panel shows three Balmer (Hβ, Hγ and Hδ>) lines and Paβ, all displaying variations. The variations are quantified in the lower plot of that panel, showing variations in a similar velocity range as in the lower left panel. The third panel shows the Ca II triplet, and the last panel the Na I doublet. The He I λ 1083.0 nm and Paβ line only include two spectra due to the limited wavelength range of HERMES compared to X-shooter. The HERMES observation on 28-10-2022 shows strong telluric contamination.
Current usage metrics show cumulative count of Article Views (full-text article views including HTML views, PDF and ePub downloads, according to the available data) and Abstracts Views on Vision4Press platform.
Data correspond to usage on the plateform after 2015. The current usage metrics is available 48-96 hours after online publication and is updated daily on week days.
Initial download of the metrics may take a while.