Fig. 10
Download original image
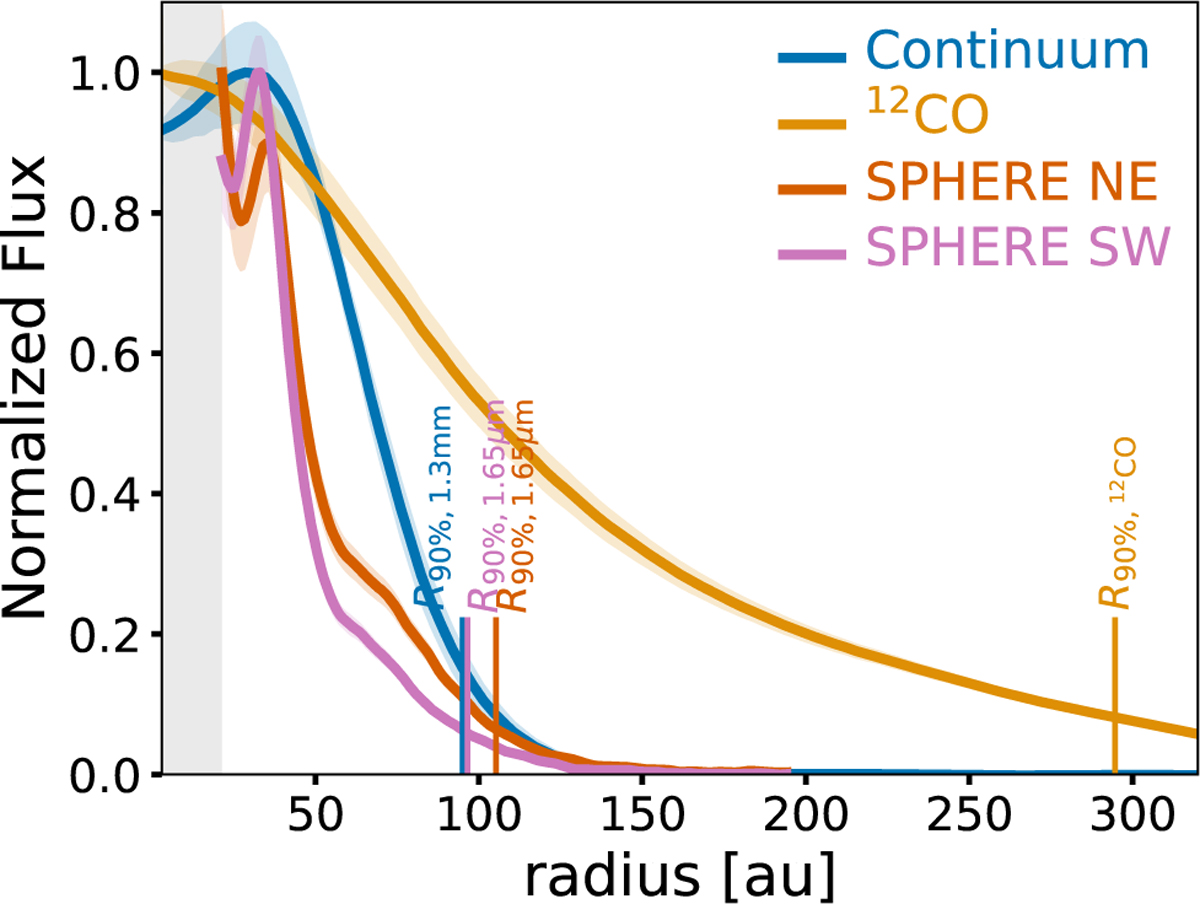
Azimuthally averaged radial intensity proflies of the deprojected images from ALMA dust continuum and the moment 0 maps of the 12CO from ALMA Band-6 observations of PDS 111. Each profile is normalized to the peak. The ALMA profiles include the standard deviation of each elliptical bin divided by the square root of the number of beams spanning the full azimuthal angle at each radial bin. For the SPHERE observations, we take two radial cuts at the North-East (NE) and South-West (SW) of the major axis of the disk. The vertical lines show the radius that encloses 90% of the emission in each of the maps. The gray region shows the size of the coronagraph in the SPHERE observations.
Current usage metrics show cumulative count of Article Views (full-text article views including HTML views, PDF and ePub downloads, according to the available data) and Abstracts Views on Vision4Press platform.
Data correspond to usage on the plateform after 2015. The current usage metrics is available 48-96 hours after online publication and is updated daily on week days.
Initial download of the metrics may take a while.