Open Access
Fig. 4
Download original image
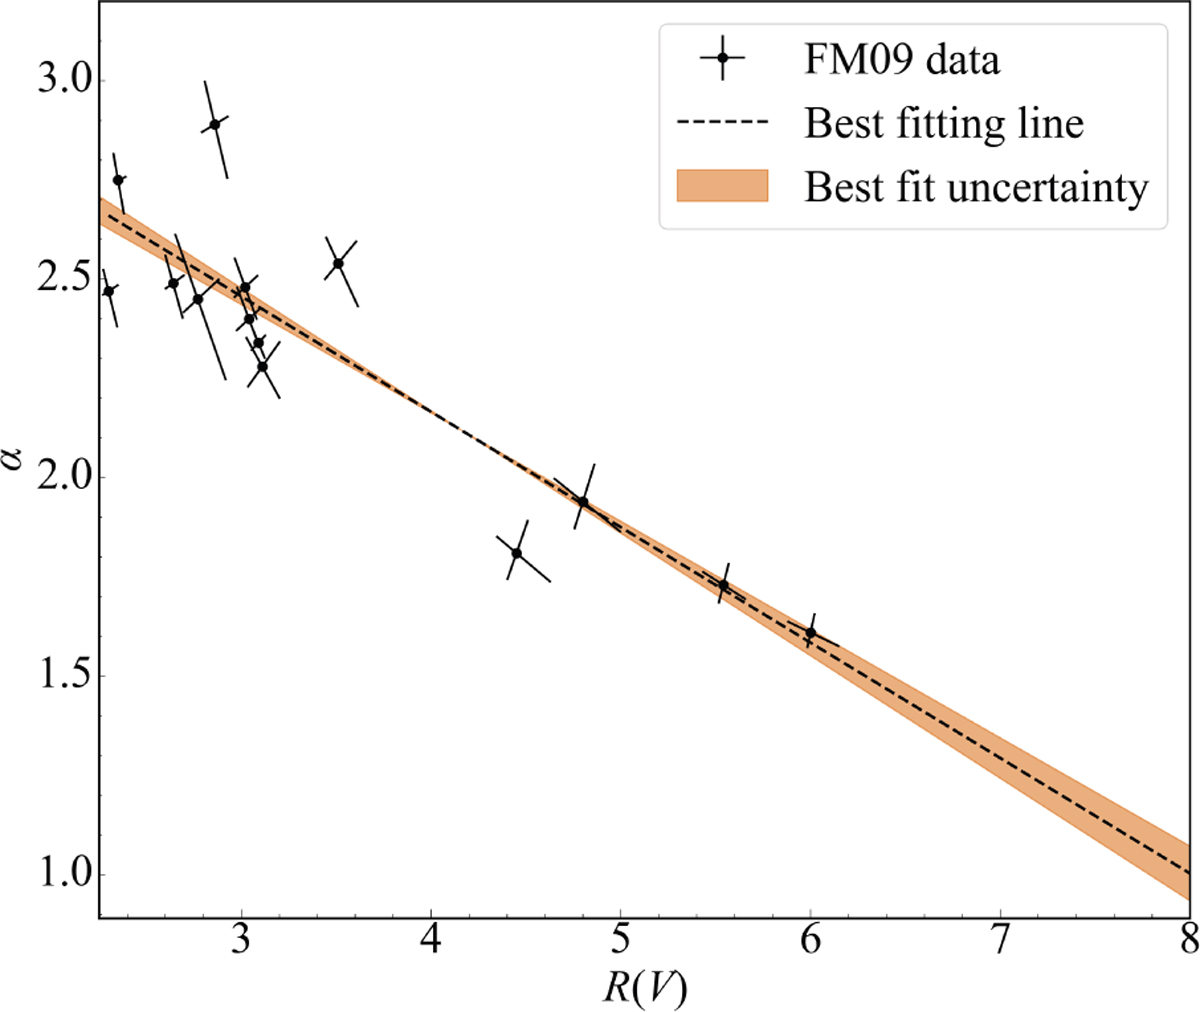
Relationship between R(V) and α determined by Fitzpatrick & Massa (2009). The uncertainties in α and R(V) are correlated, and the direction and strength of the error bars reflect that. The orange shaded band is the 1σ uncertainty of the fit, determined by performing 1000 Monte Carlo iterations.
Current usage metrics show cumulative count of Article Views (full-text article views including HTML views, PDF and ePub downloads, according to the available data) and Abstracts Views on Vision4Press platform.
Data correspond to usage on the plateform after 2015. The current usage metrics is available 48-96 hours after online publication and is updated daily on week days.
Initial download of the metrics may take a while.