Fig. B.1
Download original image
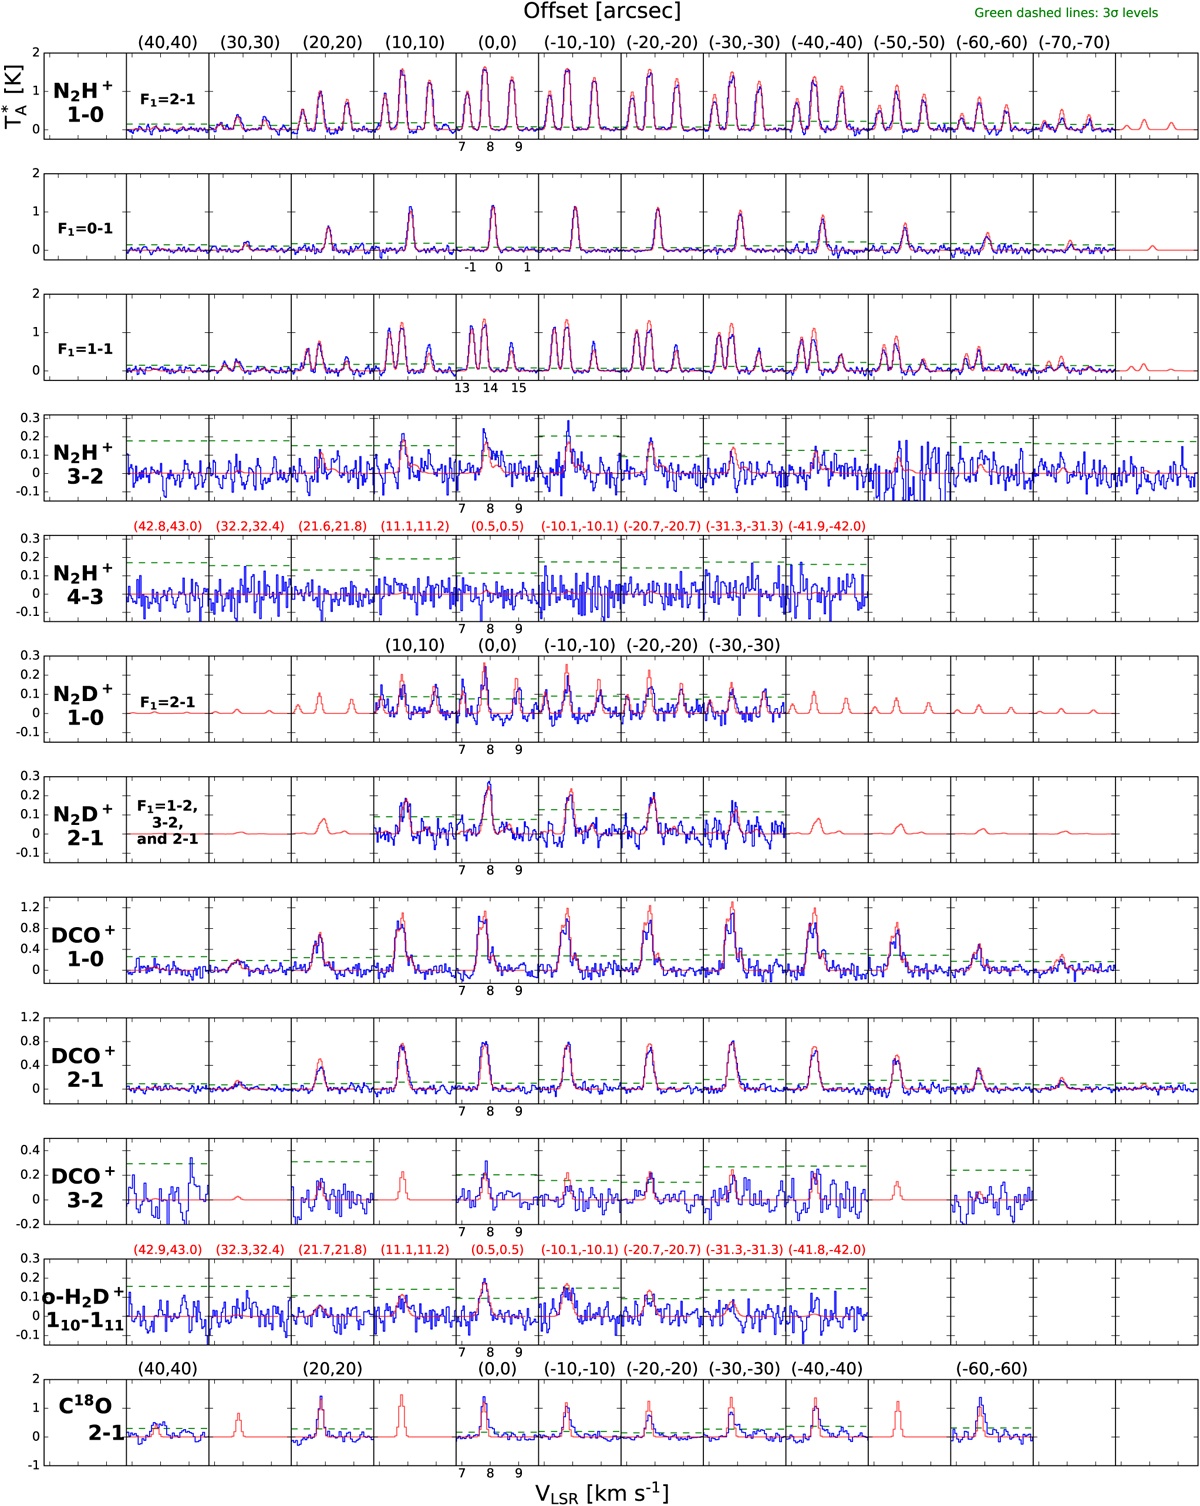
Spectral observations along the main cut compared to our best-fit radiative transfer model. The blue spectra show the observational data and the red spectra show the models. Each column corresponds to different offsets from the center of L 1498 according to Fig. 1. Each row shows a spectral line, except that the N2H+ (1−0) line is split into three rows corresponding to its different F1 -transition groups. The green dashed lines indicate the 3σ noise level. Observational parameters are summarized in Table 1.
Current usage metrics show cumulative count of Article Views (full-text article views including HTML views, PDF and ePub downloads, according to the available data) and Abstracts Views on Vision4Press platform.
Data correspond to usage on the plateform after 2015. The current usage metrics is available 48-96 hours after online publication and is updated daily on week days.
Initial download of the metrics may take a while.