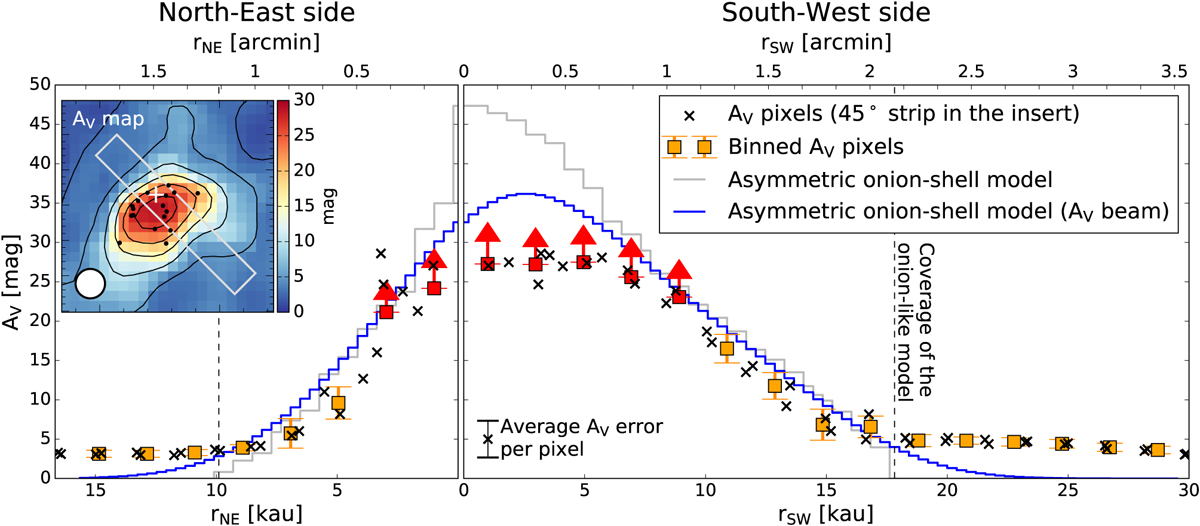
Fig. 7
Download original image
Comparison of the NICER-derived AV profile and the AV profile derived from the column density from the best-fit asymmetric onion-like model along the main cut. The black crosses are the NICER-derived AV values at each pixel in the 50″-wide strip on the AV map shown as the insert. The orange and red squares with error bars show the radially averaged AV profile with the 14.1″-bin from the strip, where the central region is represented as lower limits due to the lack of the Ks-band detections. The gray step curve shows the AV profiles converted from our onion-like model, while the blue step curve is convolved with the AV-beam of 50″. The coverage of our onion-like model is shown by black dashed lines. The insert shows the NICER-derived AV map with the 50″-beam (Fig. 2g) overlaid with black dots, indicating the stars only detected in the IRAC1/2 bands but with the artificial Ks-band detection (see Sect. 4.4).
Current usage metrics show cumulative count of Article Views (full-text article views including HTML views, PDF and ePub downloads, according to the available data) and Abstracts Views on Vision4Press platform.
Data correspond to usage on the plateform after 2015. The current usage metrics is available 48-96 hours after online publication and is updated daily on week days.
Initial download of the metrics may take a while.