Fig. 5
Download original image
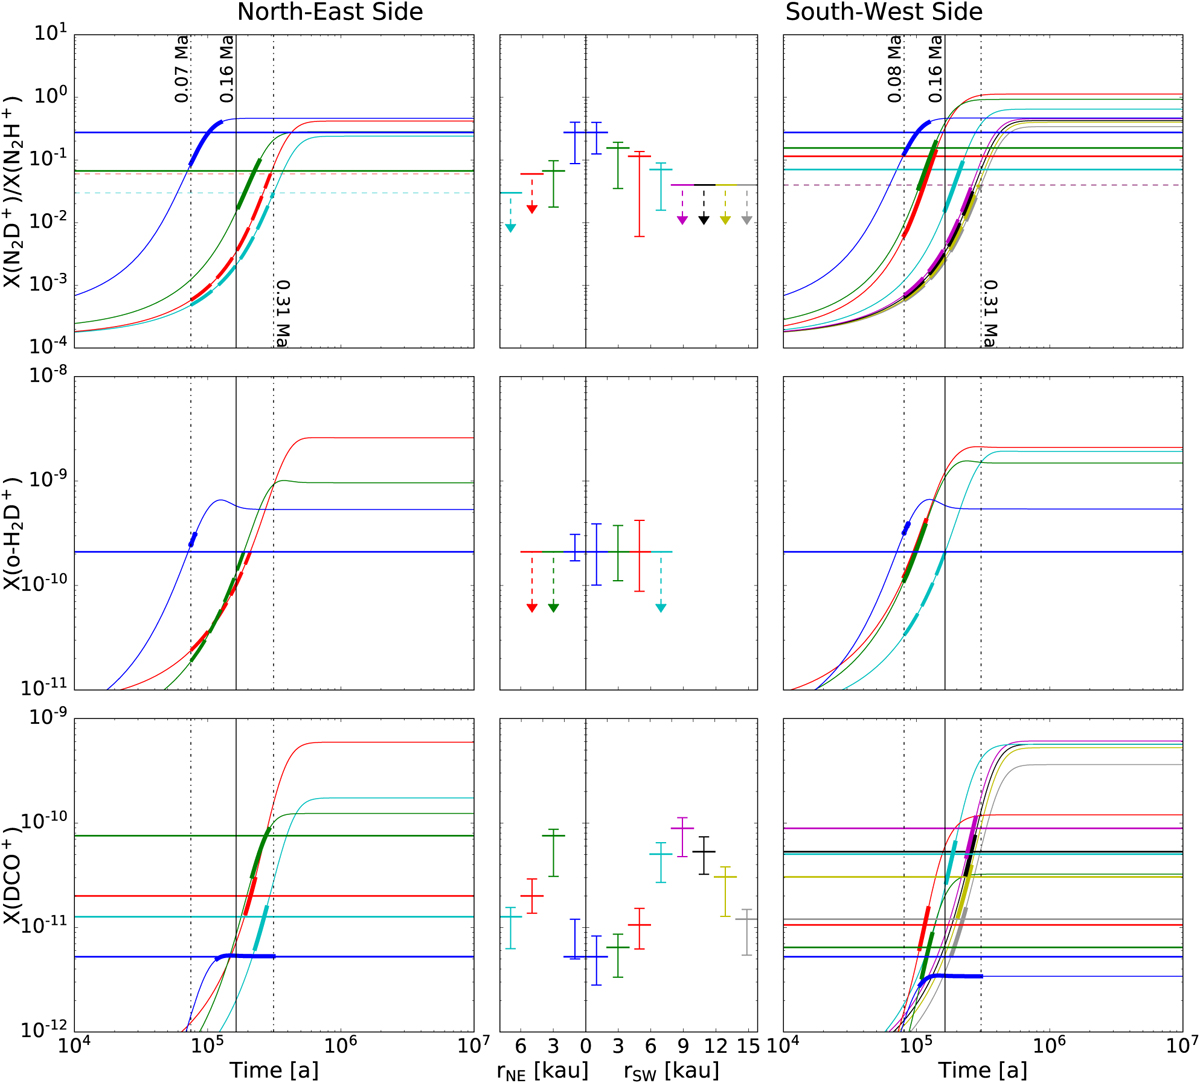
Chemical modeling of the abundance ratio of N2D+/N2H+ and the abundances of o-H2D+ and DCO+ for each layer. Left and right columns: chemical model solutions (curves) and the observationally derived values (horizontal lines). Middle column: observationally derived profiles with uncertainties from Fig. 4. The model solutions and observed values are color-coded by different layers. The models are calculated with an initial OPR(H2) of 3, a cosmic ray ionization rate (ξ) of 3 × 10⁻¹⁷ s−1, and an average grain radius (agr) profile shown in Fig. 6. The two dashed-dotted vertical lines in each panel indicate a time range for which the model values cross the observations within their error bars, and we make such model curves thicker. The thick model curve is displayed as dashed if the observation only has an upper limit. The solid vertical line indicates the lower limit on the core age of L 1498 as 0.16 Ma.
Current usage metrics show cumulative count of Article Views (full-text article views including HTML views, PDF and ePub downloads, according to the available data) and Abstracts Views on Vision4Press platform.
Data correspond to usage on the plateform after 2015. The current usage metrics is available 48-96 hours after online publication and is updated daily on week days.
Initial download of the metrics may take a while.