Fig. 2
Download original image
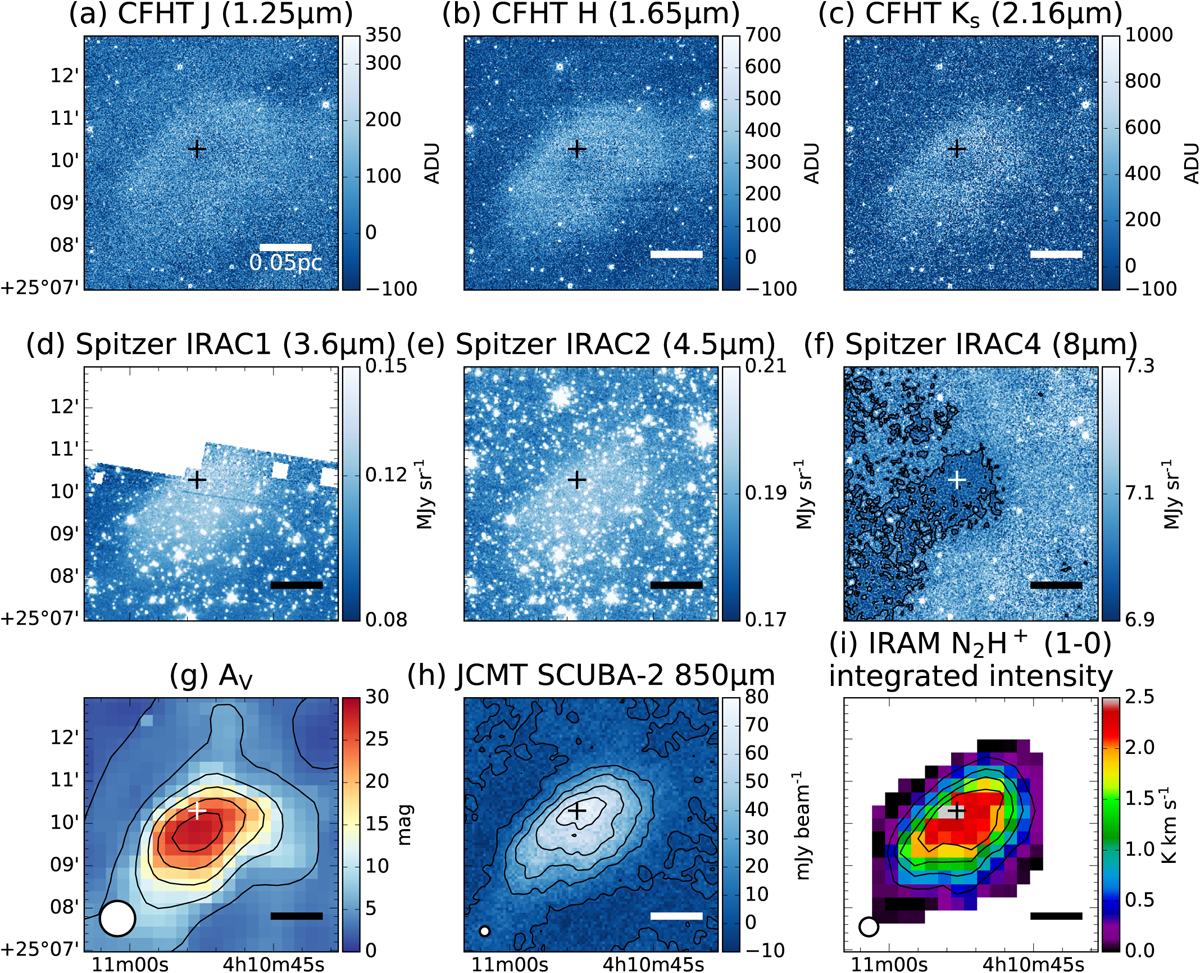
L 1498 maps of continuum, extinction, and line integrated intensity. The CFHT NIR maps at the (a) J band, (b) H band, and (c) Ks band. Spitzer MIR maps at (d) IRAC1 band, (e) IRAC2 band, and (f) IRAC4 band with its contours at 7.0 MJy sr−1. (g) Visual extinction map with a beam size of 50″ with contours at 2.5, 5, 10, 15, 20, 25 mag. (h) JCMT SCUBA-2 850 µm map with a beam size of 14″ and the contours shown in Fig. 1. (i) Integrated intensity maps of N2H+ J=1–0 from Tafalla et al. (2004), calculated within VLSR=[−0.5 km s−1, 15.2 km s−1] with its contours at 20, 40, 60, 80% of its peak at 2.5 K km s−1 and a beam size of 26″. The central cross in each panel indicates the center of L 1498. The scale bars of 0.05 pc and AV/millimeter-wavelength beam sizes are denoted in the bottom right and bottom left corners, respectively.
Current usage metrics show cumulative count of Article Views (full-text article views including HTML views, PDF and ePub downloads, according to the available data) and Abstracts Views on Vision4Press platform.
Data correspond to usage on the plateform after 2015. The current usage metrics is available 48-96 hours after online publication and is updated daily on week days.
Initial download of the metrics may take a while.