Fig. E.1
Download original image
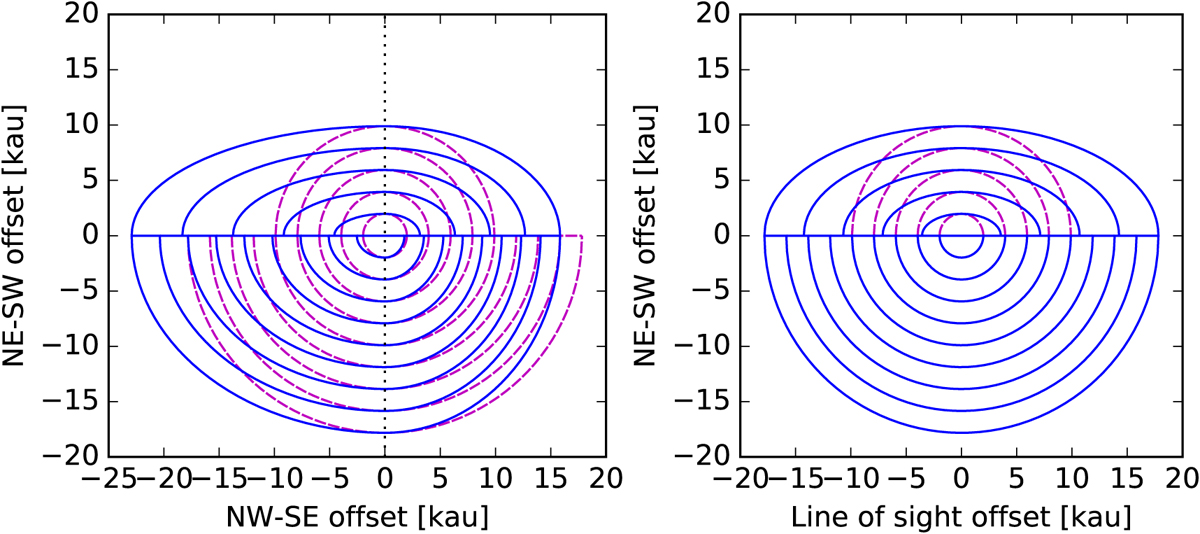
Comparison between the asymmetric and spherical onion-like models. The asymmetric layers are shown in the blue solid curves, while the spherical layers are shown in the magenta dashed curves. The left panel shows the cross-section of the models across the center and within the sky plane. The right panel shows the cross-section along the main cut (NE-SW direction) and the line of sight, where both asymmetric and spherical models are identical on the NE side.
Current usage metrics show cumulative count of Article Views (full-text article views including HTML views, PDF and ePub downloads, according to the available data) and Abstracts Views on Vision4Press platform.
Data correspond to usage on the plateform after 2015. The current usage metrics is available 48-96 hours after online publication and is updated daily on week days.
Initial download of the metrics may take a while.