Fig. D.1
Download original image
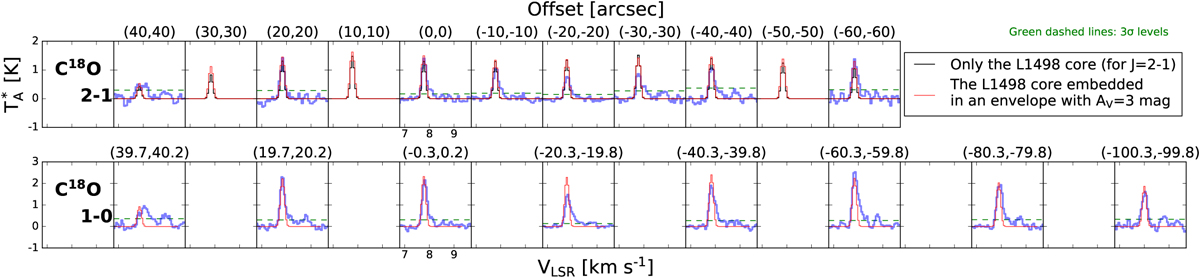
C180 (1−0) and (2−1) spectra along the main cut. The blue spectra show the observational data including the archival J=1−0 spectra from Tafalla et al. (2004) and our J=2−1 spectra. The black spectra show the modeled J=2−1 spectra from Fig. B.1. The red spectra show the modeled spectra of the asymmetric onion-like model embedded in an envelope that is a layer with AV =3 mag. Each column corresponds to different offsets from the center of L 1498. The green dashed lines indicate the 3σ noise level.
Current usage metrics show cumulative count of Article Views (full-text article views including HTML views, PDF and ePub downloads, according to the available data) and Abstracts Views on Vision4Press platform.
Data correspond to usage on the plateform after 2015. The current usage metrics is available 48-96 hours after online publication and is updated daily on week days.
Initial download of the metrics may take a while.