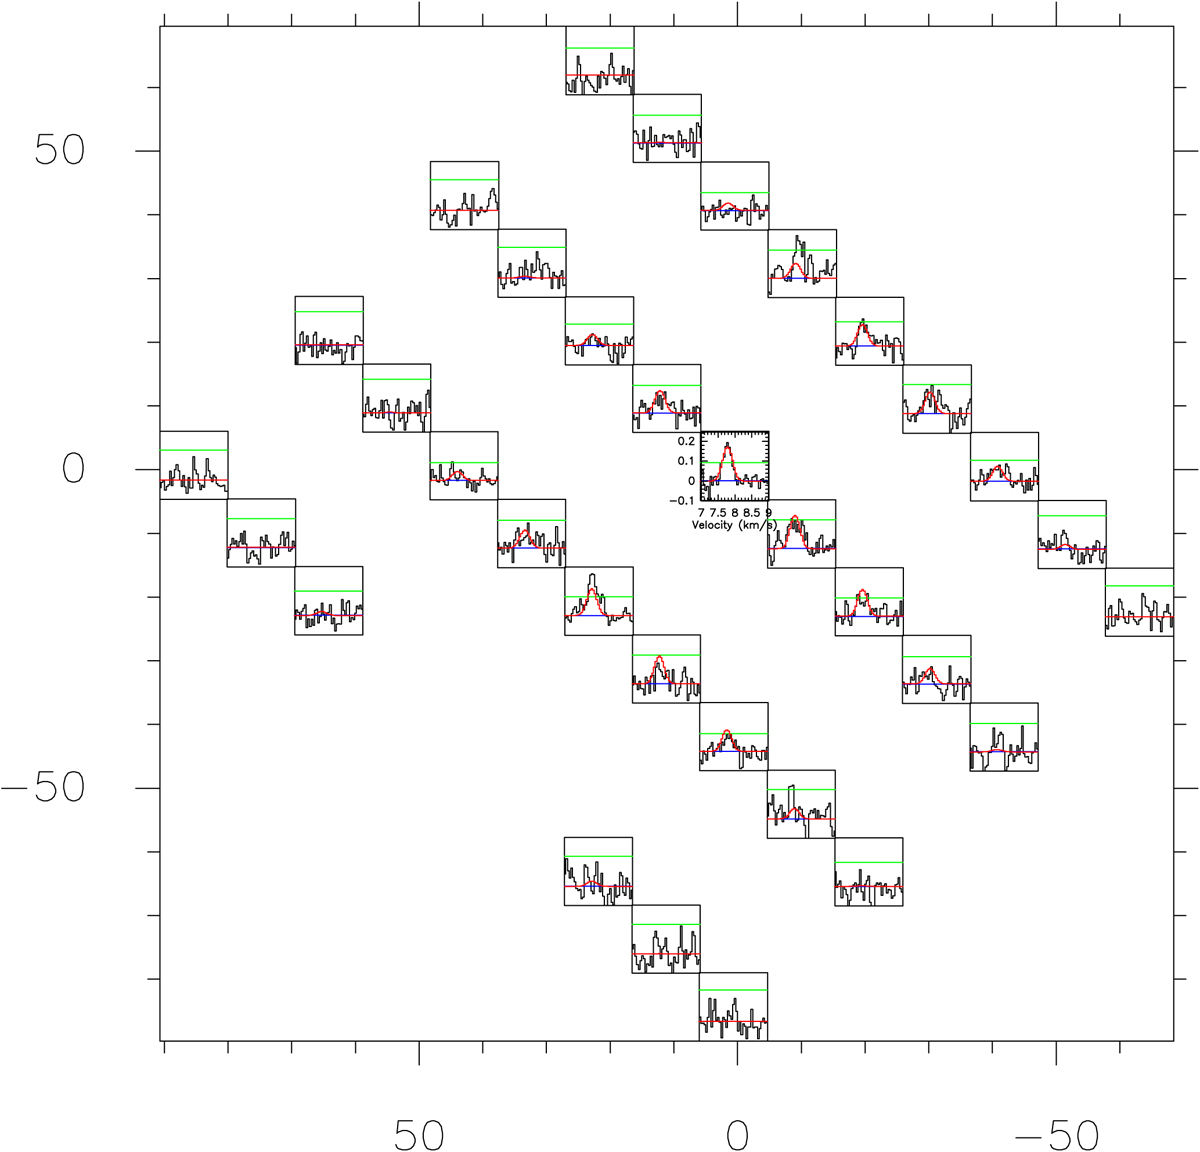
Fig. C.2
Download original image
o-H2D+ (110−111) spectra. The x- and y-axes of the grid are the RA and Dec offsets with respect to the center of L 1498. Each cell shows the observational spectra as black, the modeled spectra as red, and the baselines as blue. The 3σ noise levels are shown in green horizontal lines. The dimensions of ![]() and VLSR at each cell are −0.1~0.25 K and 7~9 km s−1, respectively, denoted in the cell closest to the core center, (0.5″, 0.5″).
and VLSR at each cell are −0.1~0.25 K and 7~9 km s−1, respectively, denoted in the cell closest to the core center, (0.5″, 0.5″).
Current usage metrics show cumulative count of Article Views (full-text article views including HTML views, PDF and ePub downloads, according to the available data) and Abstracts Views on Vision4Press platform.
Data correspond to usage on the plateform after 2015. The current usage metrics is available 48-96 hours after online publication and is updated daily on week days.
Initial download of the metrics may take a while.