Fig. 1
Download original image
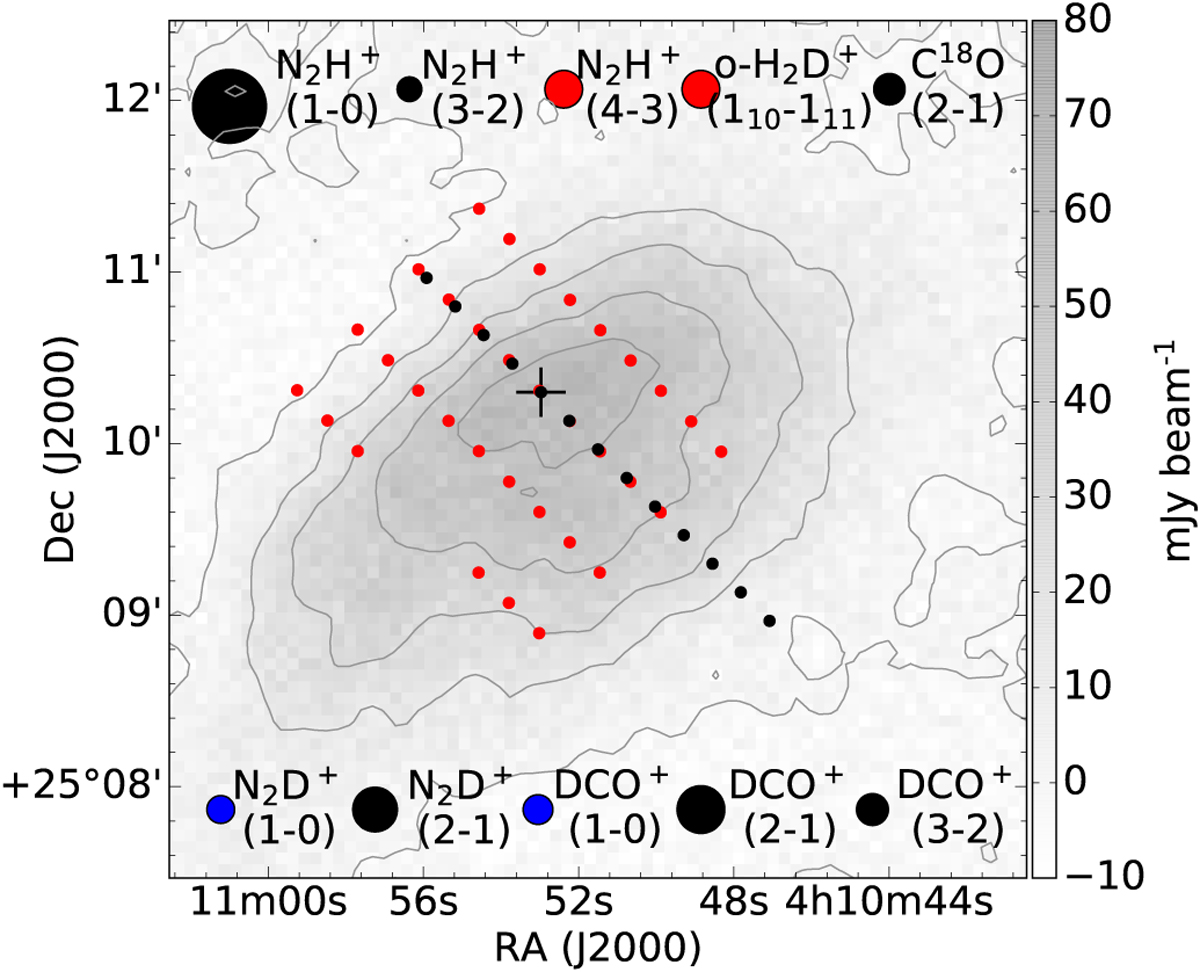
Multi-pointing grids overlaid with the SCUBA-2850 µm map. The black dots in a (∆RA, ∆Dec)=(10″, 10″)-spacing 45º-cut show the pointings of IRAM 30-m and GBT observations. The red dotted grid shows the pointings of JCMT observations. The circles at the top and bottom indicate the beam sizes (θMB) of each spectral observation with the same color as the pointing grid except that GBT beam sizes are shown in blue. The 850 µm map is shown in grayscale with a beam size of 14″ and overlaid with its contours at 0%, 20%, 40%, 60%, and 80% of its peak intensity at 78 mJy beam−1.
Current usage metrics show cumulative count of Article Views (full-text article views including HTML views, PDF and ePub downloads, according to the available data) and Abstracts Views on Vision4Press platform.
Data correspond to usage on the plateform after 2015. The current usage metrics is available 48-96 hours after online publication and is updated daily on week days.
Initial download of the metrics may take a while.