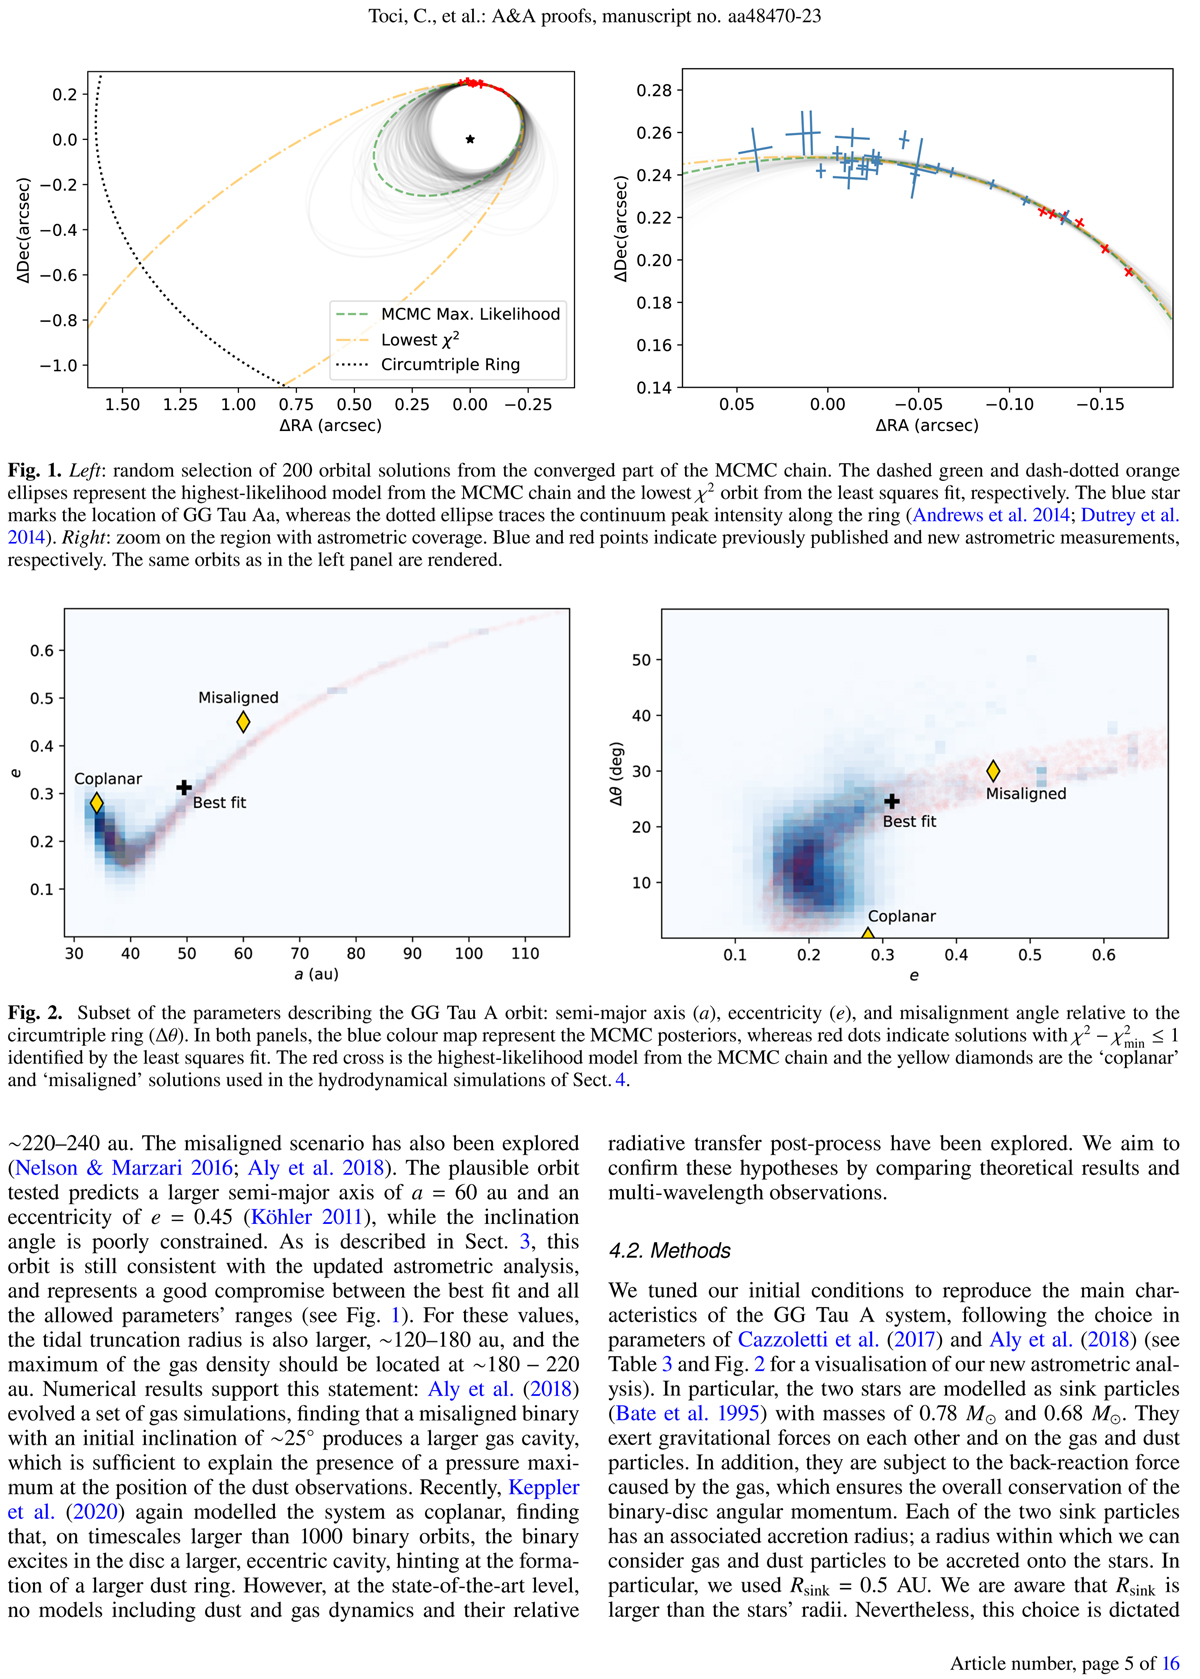
Fig. 2

Download original image
Subset of the parameters describing the GG Tau A orbit: semi-major axis (a), eccentricity (e), and misalignment angle relative to the circumtriple ring (Δθ). In both panels, the blue colour map represent the MCMC posteriors, whereas red dots indicate solutions with ![]() identified by the least squares fit. The red cross is the highest-likelihood model from the MCMC chain and the yellow diamonds are the ‘coplanar’ and ‘misaligned’ solutions used in the hydrodynamical simulations of Sect. 4.
identified by the least squares fit. The red cross is the highest-likelihood model from the MCMC chain and the yellow diamonds are the ‘coplanar’ and ‘misaligned’ solutions used in the hydrodynamical simulations of Sect. 4.
Current usage metrics show cumulative count of Article Views (full-text article views including HTML views, PDF and ePub downloads, according to the available data) and Abstracts Views on Vision4Press platform.
Data correspond to usage on the plateform after 2015. The current usage metrics is available 48-96 hours after online publication and is updated daily on week days.
Initial download of the metrics may take a while.


