Fig. 12
Download original image
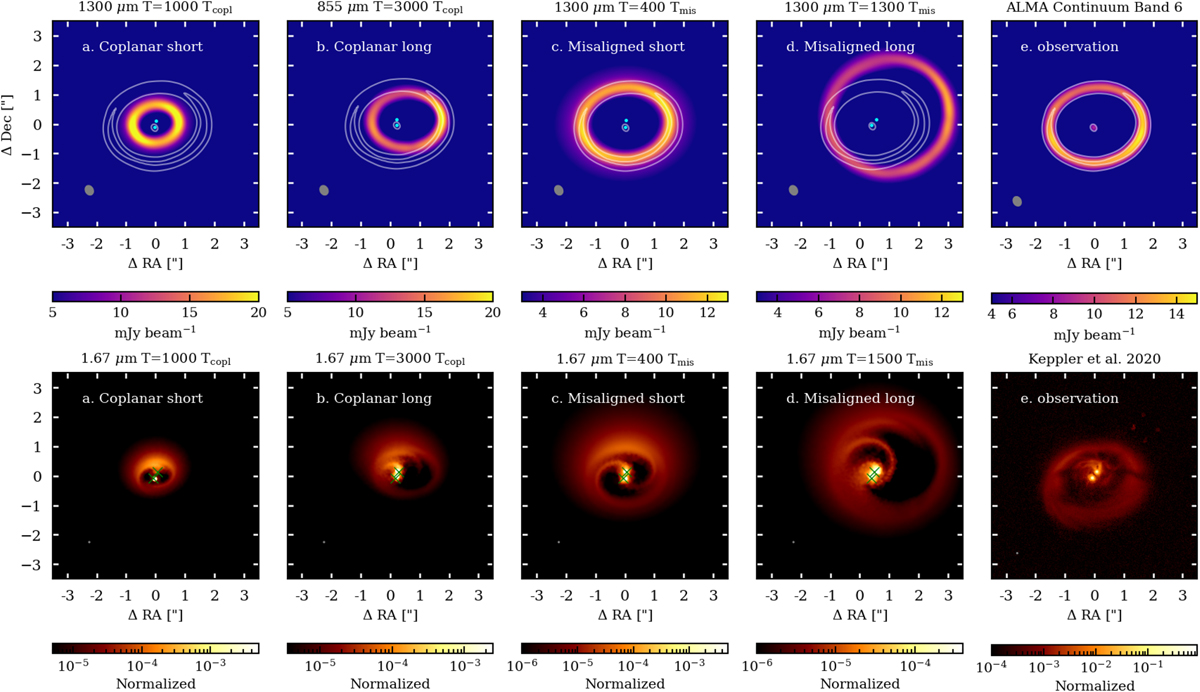
Comparison between the synthetic images at 1300 µm (top) and 1.67 µm (bottom) from the four representative snapshots (two for the coplanar case, a and b, and two for the misaligned case, c and d) and the observed sizes of the dust ring of GG Tau A in Band 6 (see e.g. Phuong et al. 2020a) and gas cavity obtained with SPHERE (Keppler et al. 2020). The stars are shown as cyan dots. The 6 and 12 mJy contours of the continuum observation are over-plotted on the models in grey. In the continuum emission (top), the position of the circumstellar disc detected around GG Tau Aa is also shown, and it is used to centre the observed dust ring on the simulation. In the 1.67 µm images, the positions of the stars in Keppler et al. (2020) are shown as green crosses and are used to centre the observed scattered-light image.
Current usage metrics show cumulative count of Article Views (full-text article views including HTML views, PDF and ePub downloads, according to the available data) and Abstracts Views on Vision4Press platform.
Data correspond to usage on the plateform after 2015. The current usage metrics is available 48-96 hours after online publication and is updated daily on week days.
Initial download of the metrics may take a while.