Fig. 10
Download original image
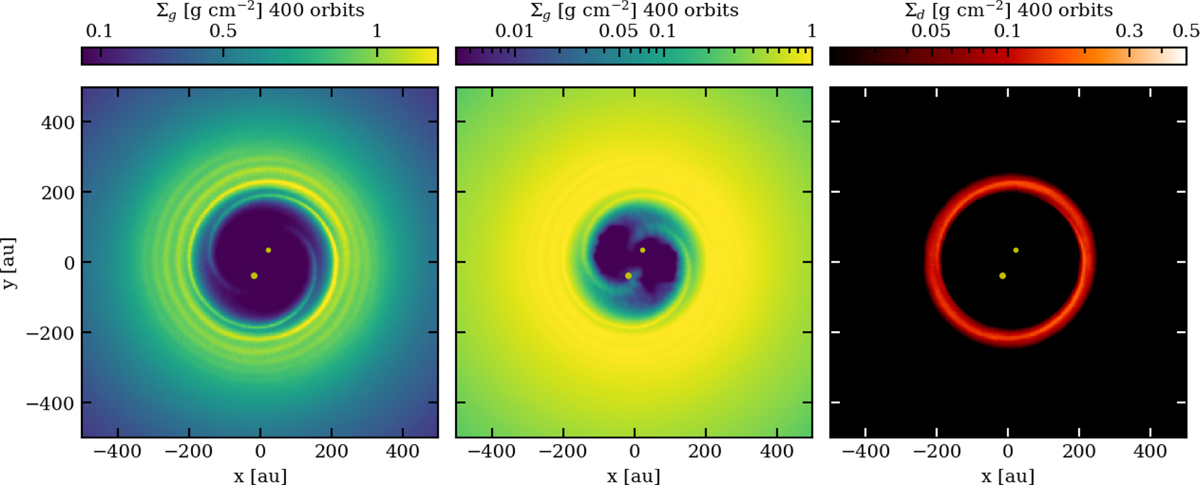
Misaligned 1 simulation: surface density after 400 orbits, corresponding to ~1.54 × 10⁵ yr. The stars are shown as yellow dots. Left and centre: gas surface density after 400 orbits (linear and log scales, respectively). Right: dust surface density. An almost circular dusty ring is formed at the location of the gas pressure maximum, which is larger with respect to the coplanar case size.
Current usage metrics show cumulative count of Article Views (full-text article views including HTML views, PDF and ePub downloads, according to the available data) and Abstracts Views on Vision4Press platform.
Data correspond to usage on the plateform after 2015. The current usage metrics is available 48-96 hours after online publication and is updated daily on week days.
Initial download of the metrics may take a while.