Fig. 1
Download original image
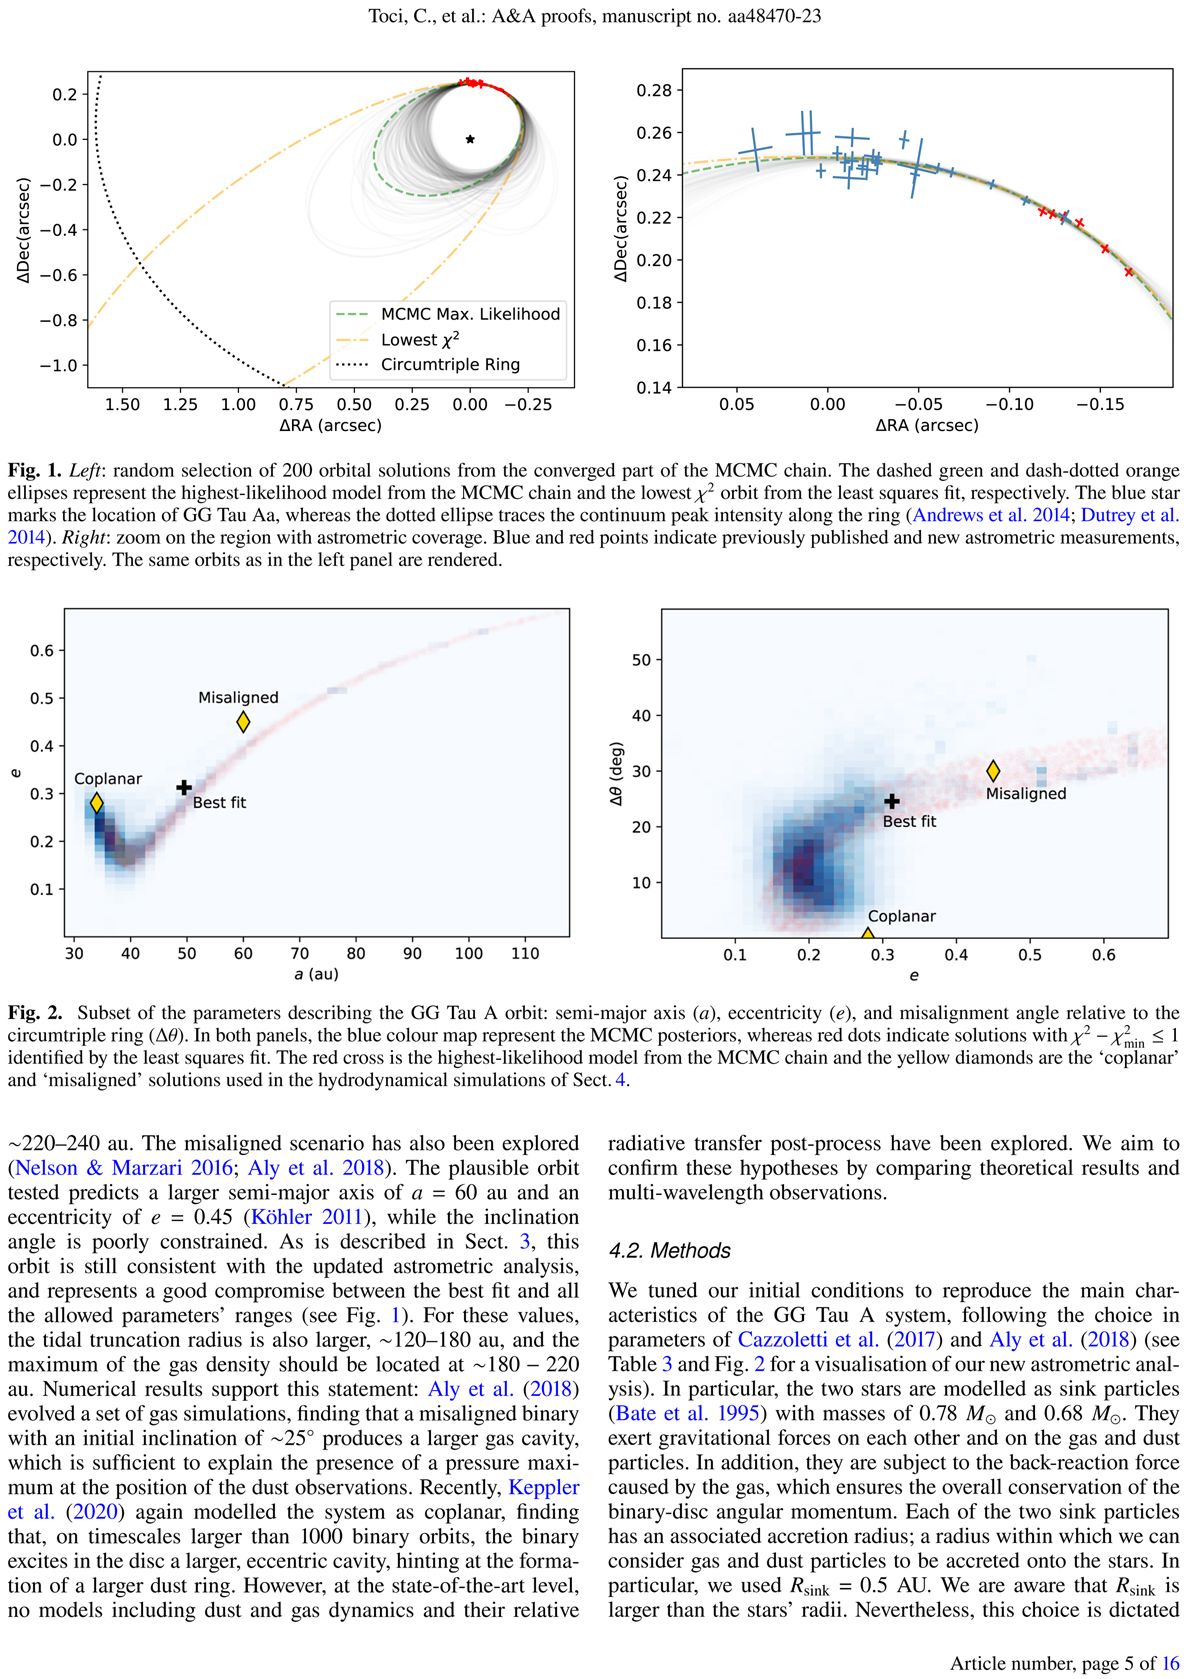
Left: random selection of 200 orbital solutions from the converged part of the MCMC chain. The dashed green and dash-dotted orange ellipses represent the highest-likelihood model from the MCMC chain and the lowest χ2 orbit from the least squares fit, respectively. The blue star marks the location of GG Tau Aa, whereas the dotted ellipse traces the continuum peak intensity along the ring (Andrews et al. 2014; Dutrey et al. 2014). Right: zoom on the region with astrometric coverage. Blue and red points indicate previously published and new astrometric measurements, respectively. The same orbits as in the left panel are rendered.
Current usage metrics show cumulative count of Article Views (full-text article views including HTML views, PDF and ePub downloads, according to the available data) and Abstracts Views on Vision4Press platform.
Data correspond to usage on the plateform after 2015. The current usage metrics is available 48-96 hours after online publication and is updated daily on week days.
Initial download of the metrics may take a while.