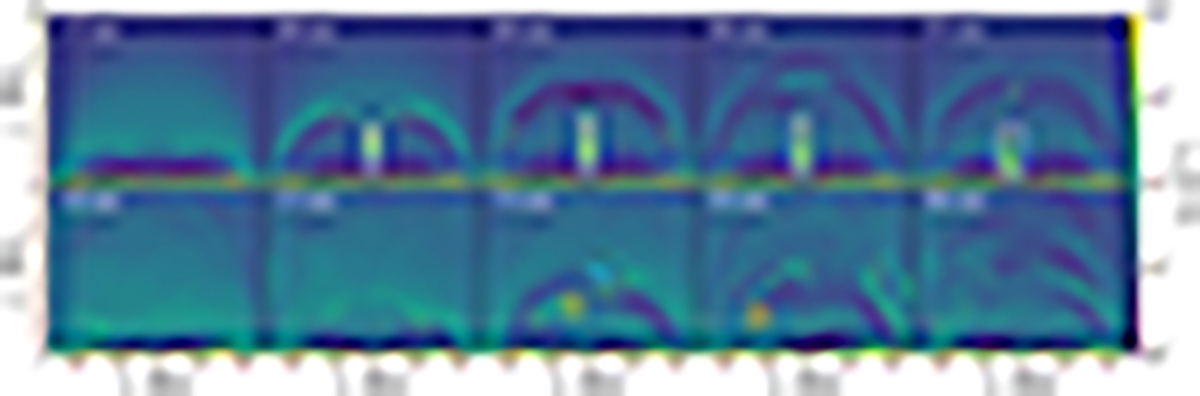
Fig. 2.
Download original image
Snapshots in time showing the distribution of nH in the domain. The top panels display the evolution in the steady heating case, while the bottom panels show the evolution in the stochastic heating case. The white boxes mark the main prominence body in the steady heating case. The orange circles at the two bottom panels mark the same condensation that accumulated a significant amount of mass (for more details see text). The cyan arrow marks an example of fragmentation (for more details see text).
Current usage metrics show cumulative count of Article Views (full-text article views including HTML views, PDF and ePub downloads, according to the available data) and Abstracts Views on Vision4Press platform.
Data correspond to usage on the plateform after 2015. The current usage metrics is available 48-96 hours after online publication and is updated daily on week days.
Initial download of the metrics may take a while.