Fig. 9.
Download original image
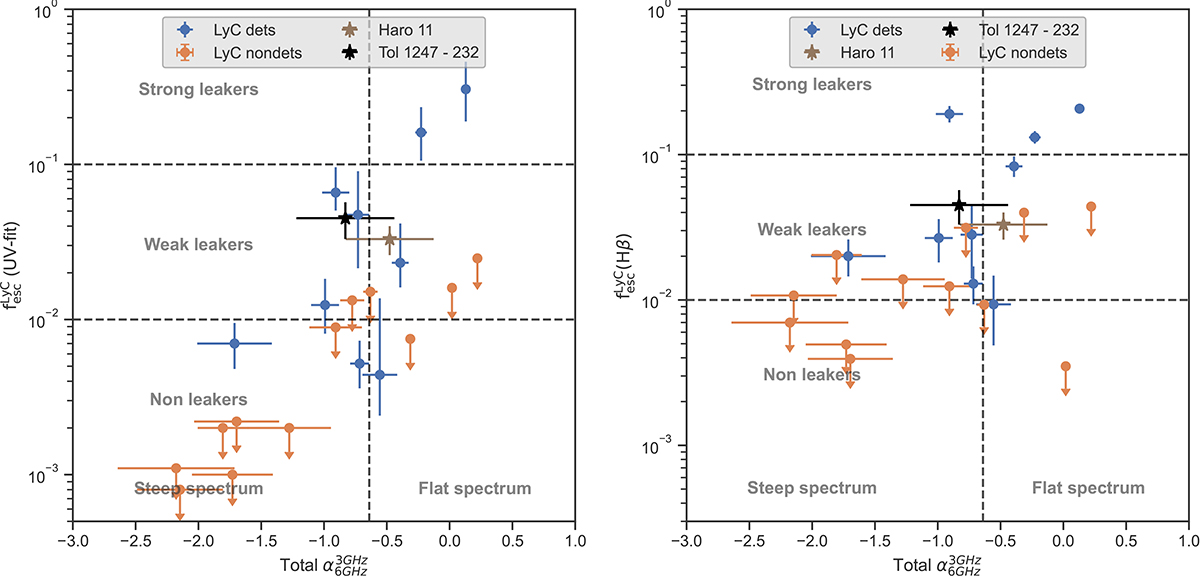
Dependence of ![]() on the total spectral index measured across C- (6 GHz) and S- (3 GHz) bands. The left panel shows the dependence on
on the total spectral index measured across C- (6 GHz) and S- (3 GHz) bands. The left panel shows the dependence on ![]() measured using the UV-fit method. And the right panel shows the dependence on
measured using the UV-fit method. And the right panel shows the dependence on ![]() measured using the Hβ method Flury et al. (2022a). The blue points in both panels show LyC detections and the orange points show LyC non-detections (1σ upper limits). We also show two known nearby leakers from the literature, Haro 11 (brown star) and Tol 1247−232 (black star). In both panels the horizontal lines demarcate the regions for strong leakers (
measured using the Hβ method Flury et al. (2022a). The blue points in both panels show LyC detections and the orange points show LyC non-detections (1σ upper limits). We also show two known nearby leakers from the literature, Haro 11 (brown star) and Tol 1247−232 (black star). In both panels the horizontal lines demarcate the regions for strong leakers (![]() ), weak leakers (
), weak leakers (![]() ), and non-leakers (
), and non-leakers (![]() ). The vertical line shows the region above and below a spectral index of a standard radio-SED (
). The vertical line shows the region above and below a spectral index of a standard radio-SED (![]() ) demarcating the region for flat and steep spectrum sources. See text for details.
) demarcating the region for flat and steep spectrum sources. See text for details.
Current usage metrics show cumulative count of Article Views (full-text article views including HTML views, PDF and ePub downloads, according to the available data) and Abstracts Views on Vision4Press platform.
Data correspond to usage on the plateform after 2015. The current usage metrics is available 48-96 hours after online publication and is updated daily on week days.
Initial download of the metrics may take a while.