Open Access
Fig. 8.
Download original image
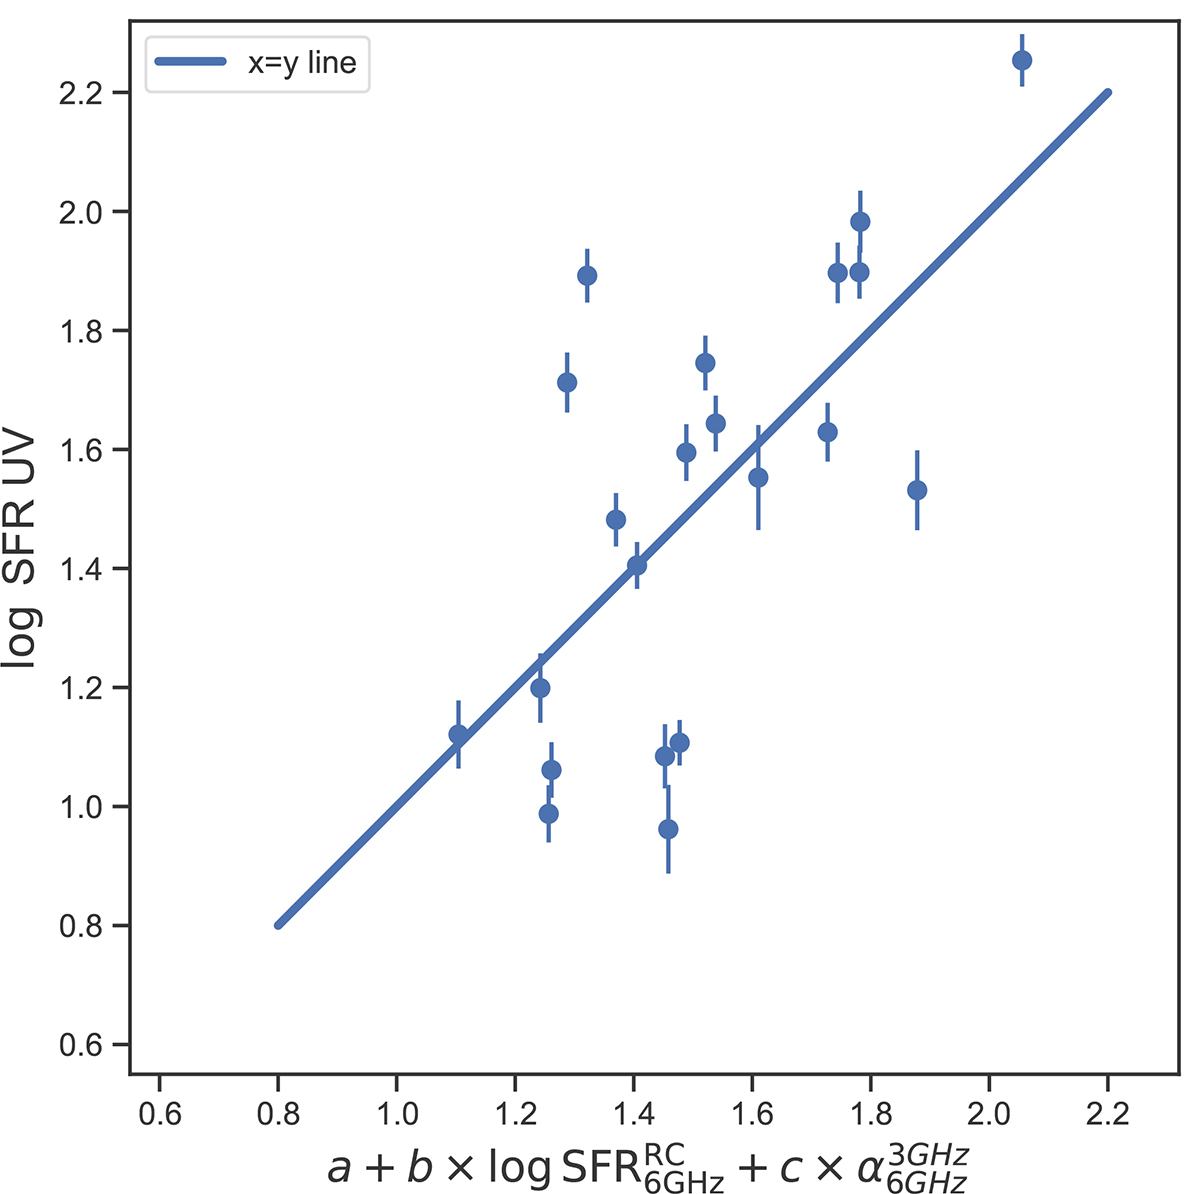
Combined fit between the linear combination of log10 SFR![]() and
and ![]() , and log10 SFRUV. The blue line shows the x = y line. Note: the residual in the fit is 0.21, which is similar to the typical scatter between different SFR tracers from Tabatabaei et al. (2017).
, and log10 SFRUV. The blue line shows the x = y line. Note: the residual in the fit is 0.21, which is similar to the typical scatter between different SFR tracers from Tabatabaei et al. (2017).
Current usage metrics show cumulative count of Article Views (full-text article views including HTML views, PDF and ePub downloads, according to the available data) and Abstracts Views on Vision4Press platform.
Data correspond to usage on the plateform after 2015. The current usage metrics is available 48-96 hours after online publication and is updated daily on week days.
Initial download of the metrics may take a while.