Fig. 7.
Download original image
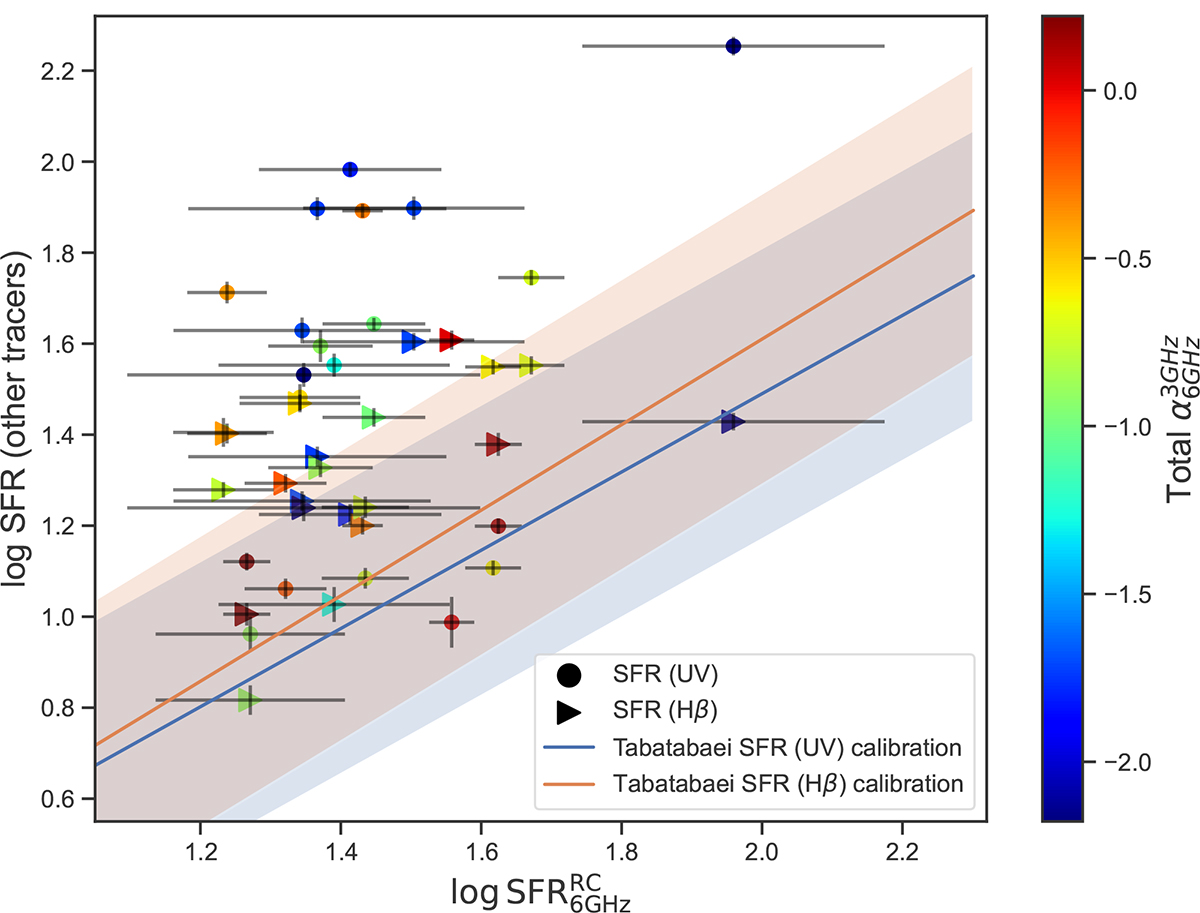
Comparison between SFR![]() and SFRUV (circles) and SFRHβ (triangles). Each of the points is color coded by their apparent
and SFRUV (circles) and SFRHβ (triangles). Each of the points is color coded by their apparent ![]() . We over plot the relation between SFR
. We over plot the relation between SFR![]() and other tracers from Tabatabaei et al. (2017) in blue (SFRUV calibration) and orange (SFRHβ calibration). The blue and orange shaded region shows the scatter in these relations.
and other tracers from Tabatabaei et al. (2017) in blue (SFRUV calibration) and orange (SFRHβ calibration). The blue and orange shaded region shows the scatter in these relations.
Current usage metrics show cumulative count of Article Views (full-text article views including HTML views, PDF and ePub downloads, according to the available data) and Abstracts Views on Vision4Press platform.
Data correspond to usage on the plateform after 2015. The current usage metrics is available 48-96 hours after online publication and is updated daily on week days.
Initial download of the metrics may take a while.