Fig. 5.
Download original image
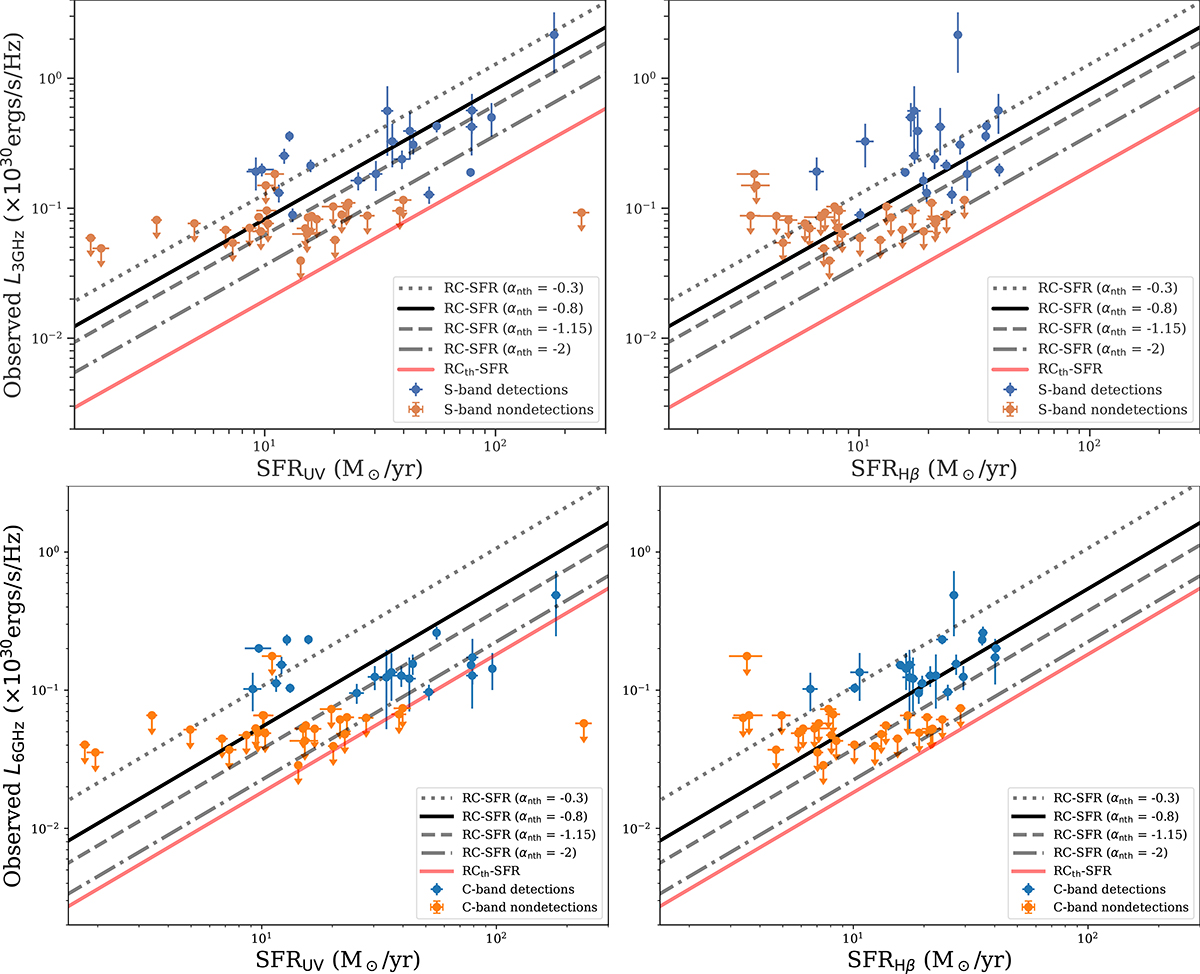
LzLCS sources on the RC–SFR relation at 3 GHz top panels and 6 GHz in the bottom panels. The left (right) panel shows the UV-based (Hβ-based) SFRs for the LzLCS sources. In all panels, the blue points represent detections in the corresponding band and the orange points represent the 3σ upper limits for non-detections. The solid black line is plotted for the standard RC–SFR relation with αnth = −0.8. The dotted, dashed and dotted dashed lines are for different values of αnth from flat (−0.3) to very steep (−2), respectively. The red solid line represents the RCth–SFR relation from Eq. (3). In all these cases, we have used a fixed value of Te = 10 000 K.
Current usage metrics show cumulative count of Article Views (full-text article views including HTML views, PDF and ePub downloads, according to the available data) and Abstracts Views on Vision4Press platform.
Data correspond to usage on the plateform after 2015. The current usage metrics is available 48-96 hours after online publication and is updated daily on week days.
Initial download of the metrics may take a while.