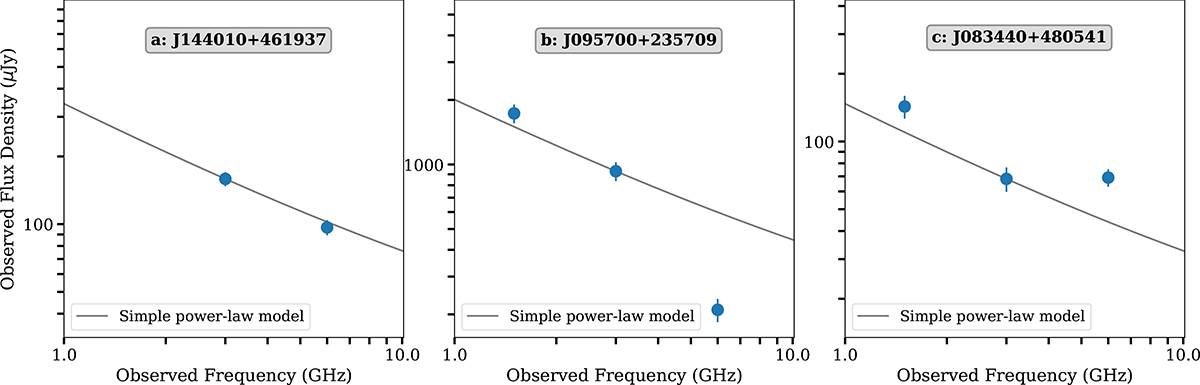
Fig. 3.
Download original image
Observed radio continuum SEDs at three frequencies: 1.5, 3, and 6 GHz for three sources in our sample. The error bars represent 1σ errors on the flux measurement. The gray line in each panel is an overlay (not a fit) for a simple radio-SED (Eq. (1)) normalized to the 3 GHz observed flux density with fth = 0.1 at 1 GHz and αnth = −0.8 commonly seen in star-forming galaxies. The left panel shows an example of a radio-SED which is close to the standard radio-SED (Eq. (1)). The middle panel shows an example that has a steep spectrum above 3 GHz and is close to the standard radio-SED below 3 GHz. The right panel shows the case of a broken SED.
Current usage metrics show cumulative count of Article Views (full-text article views including HTML views, PDF and ePub downloads, according to the available data) and Abstracts Views on Vision4Press platform.
Data correspond to usage on the plateform after 2015. The current usage metrics is available 48-96 hours after online publication and is updated daily on week days.
Initial download of the metrics may take a while.