Fig. 2.
Download original image
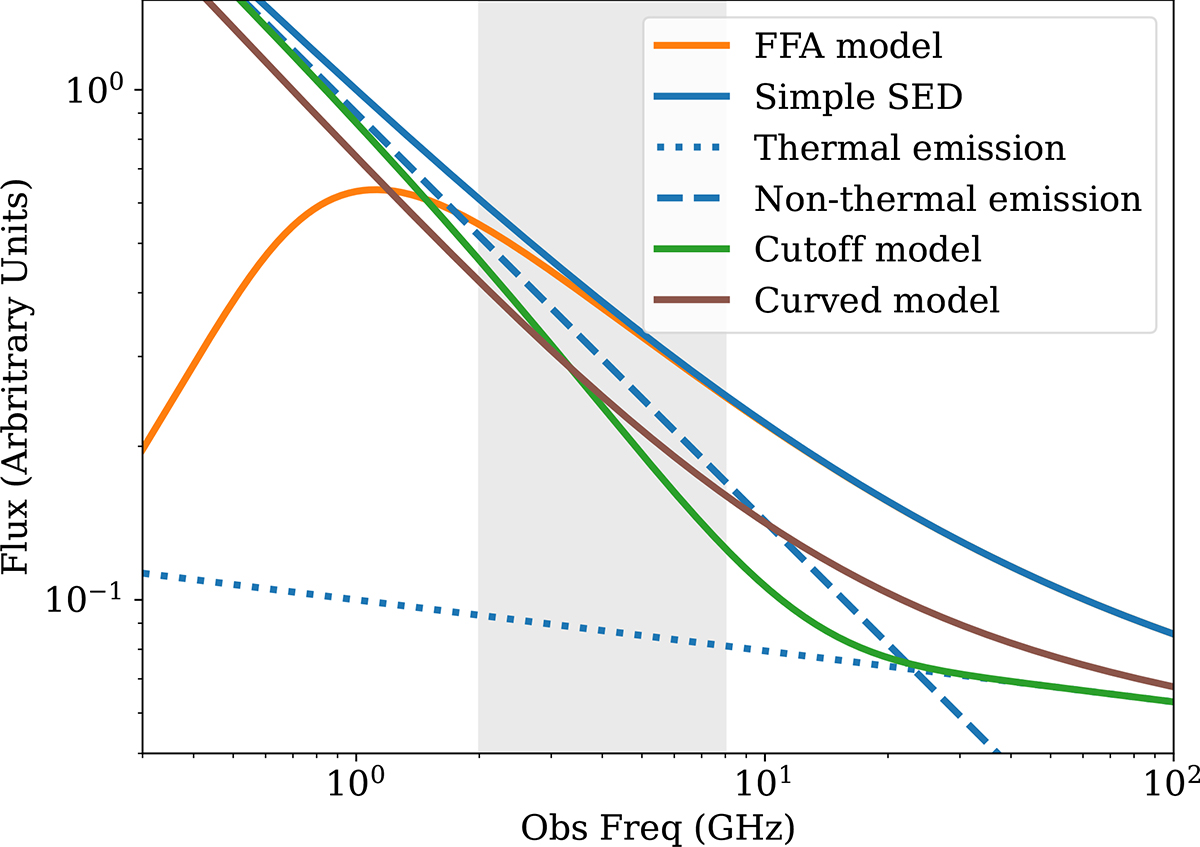
Typical radio-SED with a mixture of thermal and non-thermal emission (Eq. (1)) in blue line. The corresponding thermal and non-thermal emission components are shown in blue dashed and dotted lines. We also show the effect of FFA (Eq. (2)) with a turnover at 1 GHz in orange. And the cutoff and curved model (from Klein et al. 2018) with a high-frequency break at 6 GHz in green and red respectively. The grey-shaded area shows the region of the SED explored in this work.
Current usage metrics show cumulative count of Article Views (full-text article views including HTML views, PDF and ePub downloads, according to the available data) and Abstracts Views on Vision4Press platform.
Data correspond to usage on the plateform after 2015. The current usage metrics is available 48-96 hours after online publication and is updated daily on week days.
Initial download of the metrics may take a while.