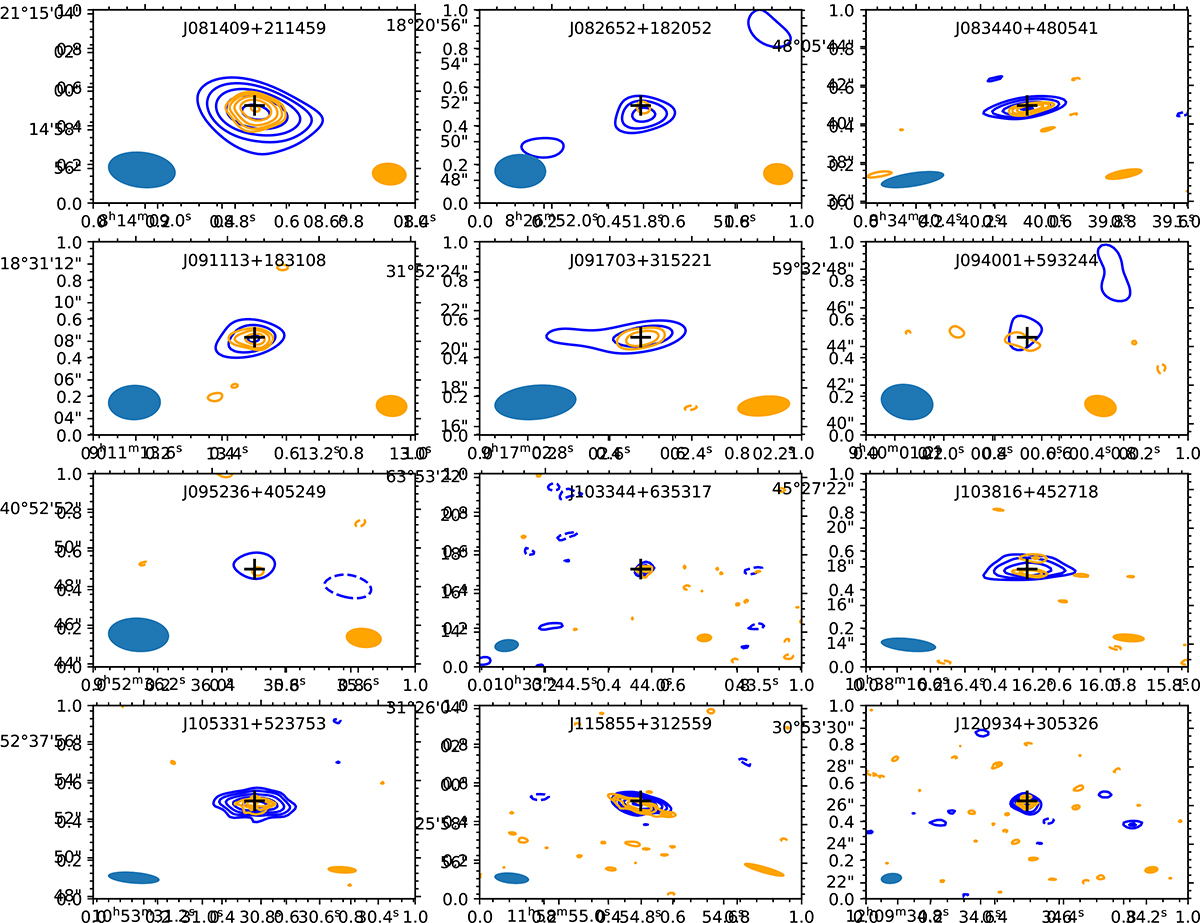
Fig. B.1.
Download original image
RC images for all the LzLCS detections in S-band (blue contours) and C-band (orange contours). The black crosshair represents the optical centre. The synthesized beam is shown blue (orange) filled ellipticals for S-band (C-band). The contours start from 3-σ, and successively increase in powers of ![]() . The dashed contours represent the -3-σ contour.
. The dashed contours represent the -3-σ contour.
Current usage metrics show cumulative count of Article Views (full-text article views including HTML views, PDF and ePub downloads, according to the available data) and Abstracts Views on Vision4Press platform.
Data correspond to usage on the plateform after 2015. The current usage metrics is available 48-96 hours after online publication and is updated daily on week days.
Initial download of the metrics may take a while.