Fig. 14.
Download original image
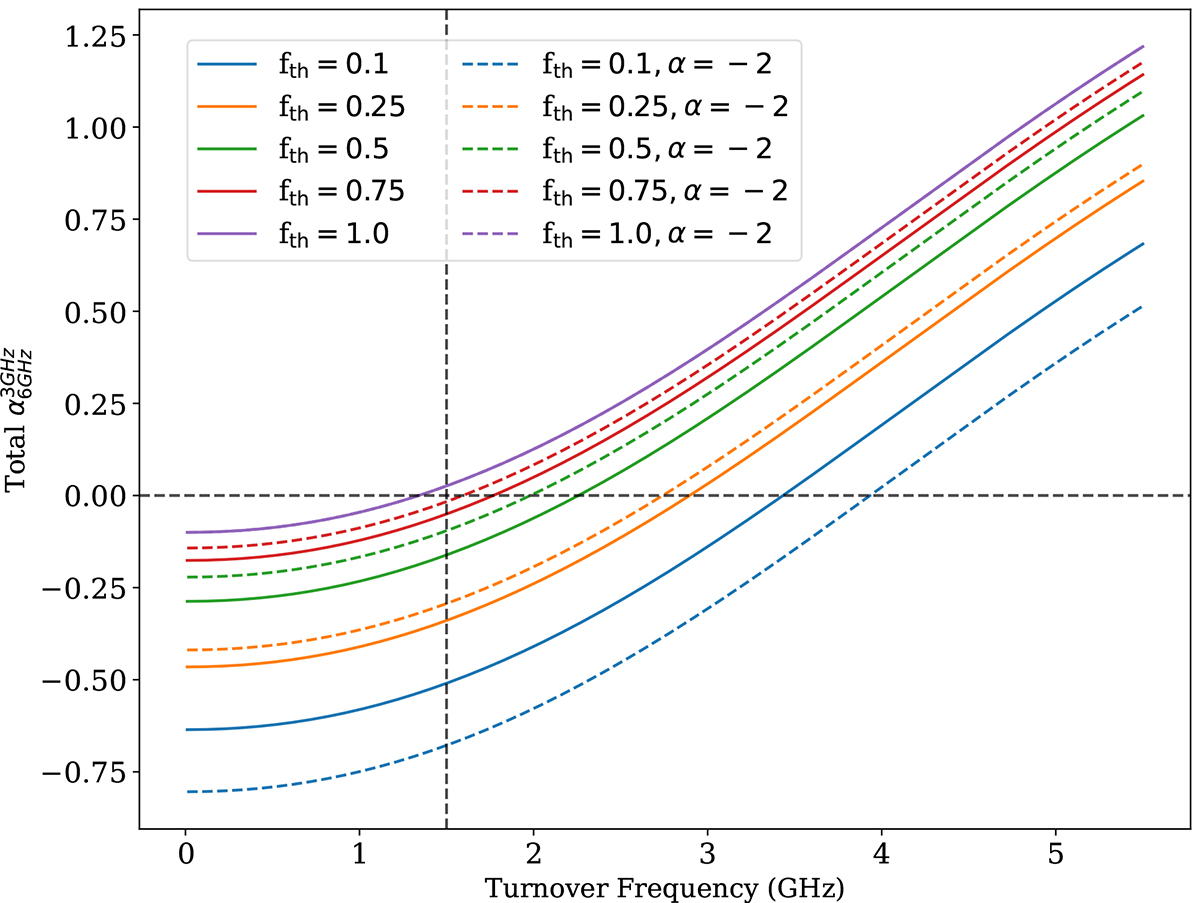
Effect of increasing the turnover frequency (νt) on ![]() . The solid lines are for a canonical αnth = −0.8, with the blue line corresponding to a fth = 0.1. The other lines shows the effect of increasing the fth. The dashed lines are for the same range of fth but with a more steep αnth = −2. The dashed horizontal line shows a value of
. The solid lines are for a canonical αnth = −0.8, with the blue line corresponding to a fth = 0.1. The other lines shows the effect of increasing the fth. The dashed lines are for the same range of fth but with a more steep αnth = −2. The dashed horizontal line shows a value of ![]() . This shows that we need FFA with a νt of ≳1.5 GHz to flatten
. This shows that we need FFA with a νt of ≳1.5 GHz to flatten ![]() .
.
Current usage metrics show cumulative count of Article Views (full-text article views including HTML views, PDF and ePub downloads, according to the available data) and Abstracts Views on Vision4Press platform.
Data correspond to usage on the plateform after 2015. The current usage metrics is available 48-96 hours after online publication and is updated daily on week days.
Initial download of the metrics may take a while.