Fig. 13.
Download original image
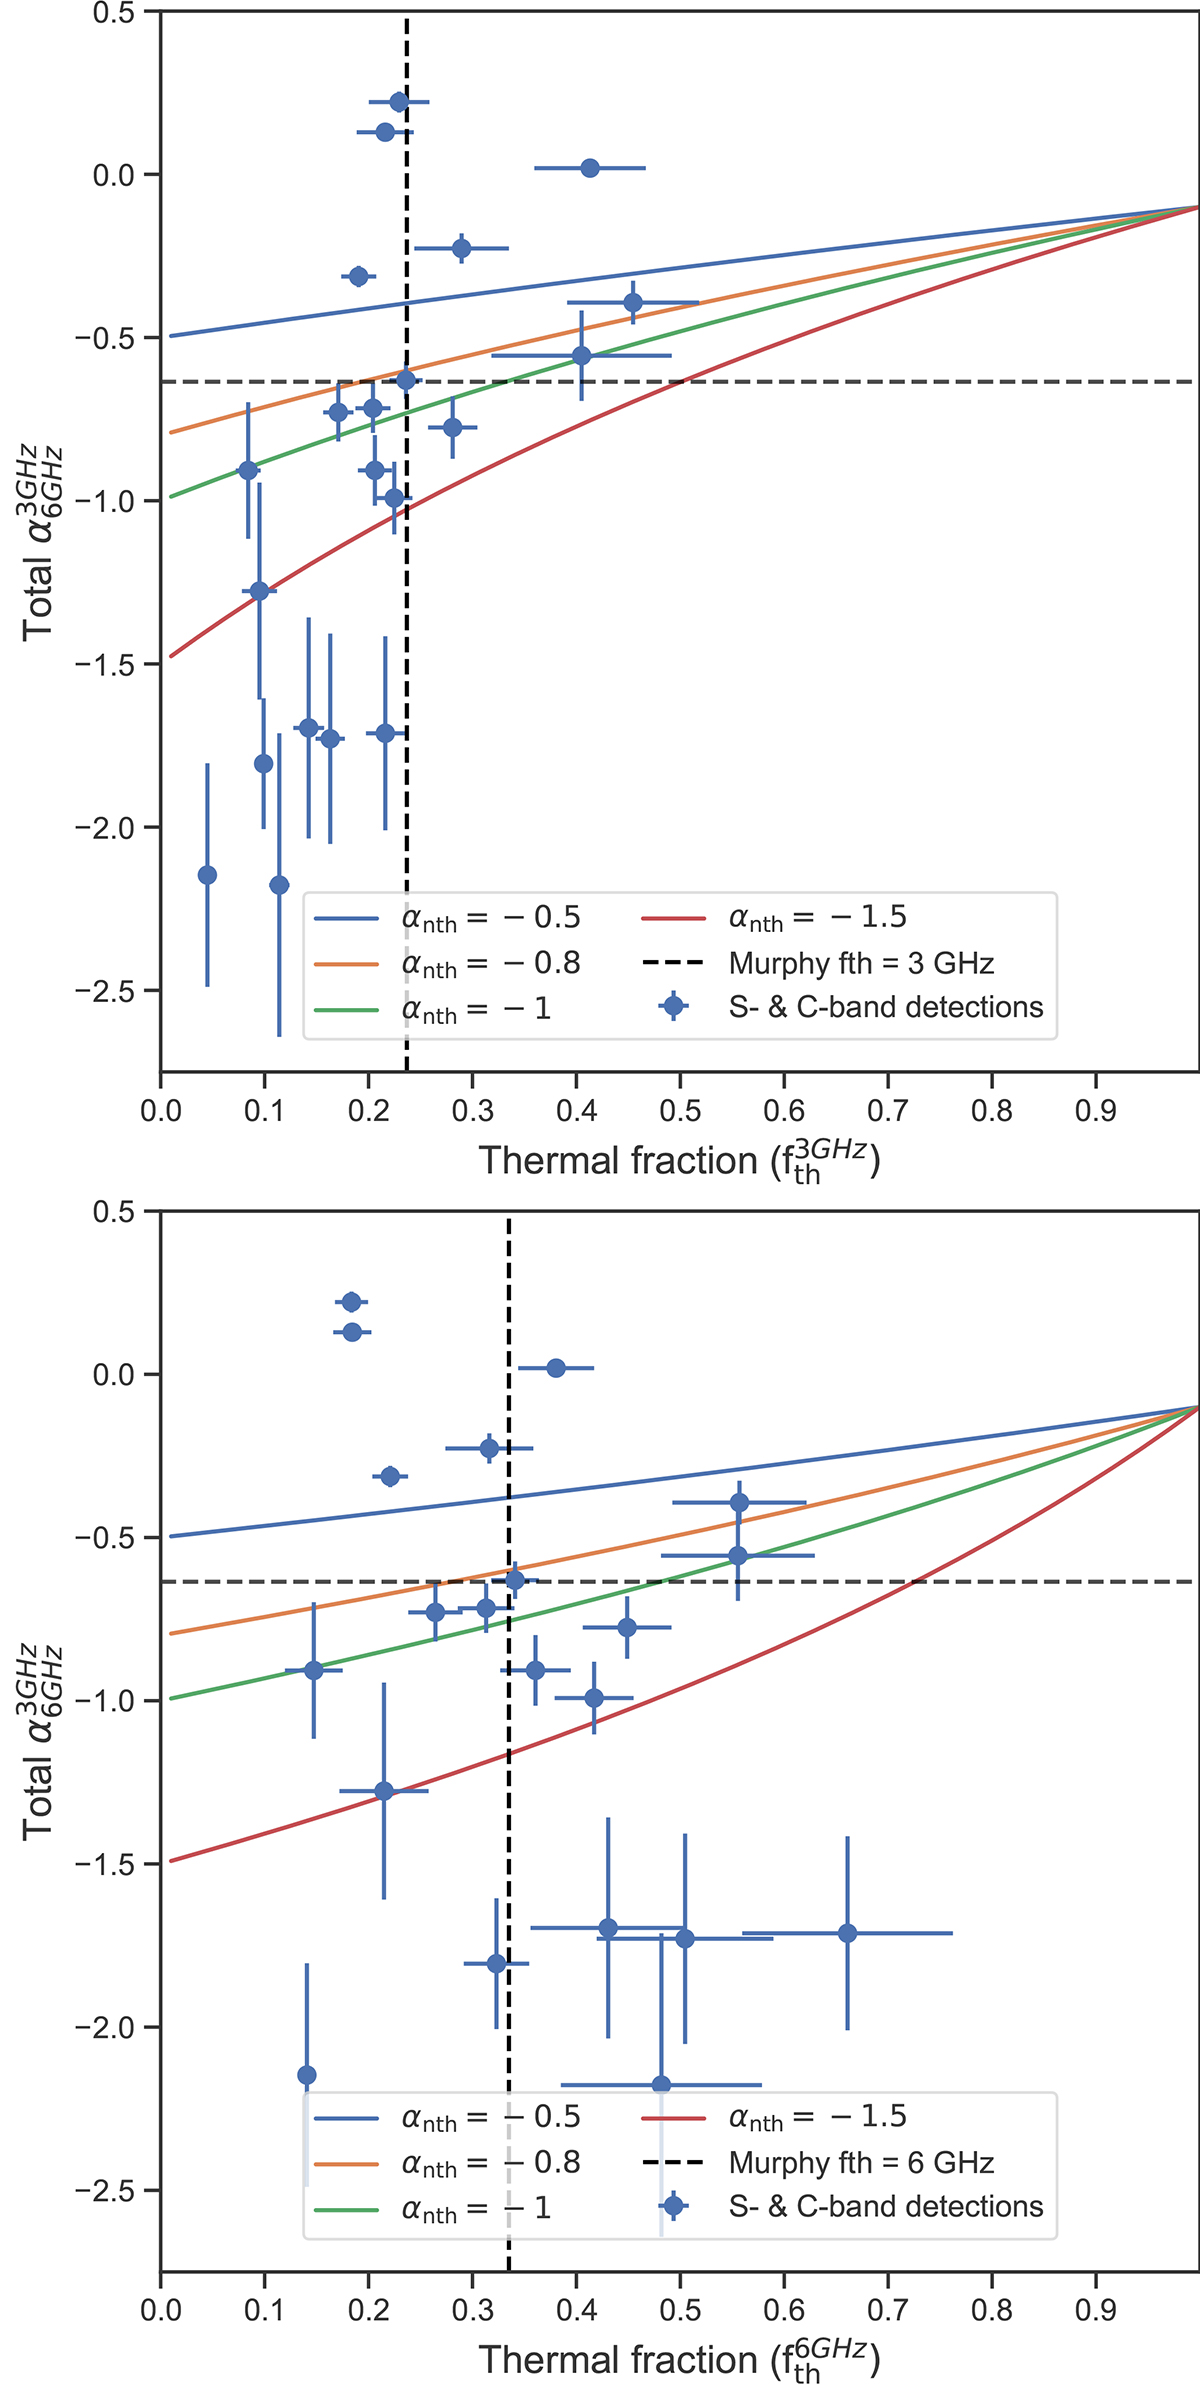
Effect of increasing fth at a reference frequency of 3 GHz (top panel) and 6 GHz (bottom panel) on the observed spectral index ![]() . Here we consider the simplest radio-SED composed of a thermal and non-thermal component as shown in Eq. (1). The different coloured lines show the effect of increasing the αnth from the canonical value of −0.8 to up to −1.5. In both the panels the dashed horizontal lines show the value of
. Here we consider the simplest radio-SED composed of a thermal and non-thermal component as shown in Eq. (1). The different coloured lines show the effect of increasing the αnth from the canonical value of −0.8 to up to −1.5. In both the panels the dashed horizontal lines show the value of ![]() for fth = 0.1, and αnth = −0.8 from Eq. (1). And the dashed vertical line shows the expected value of the thermal fraction at 3 and 6 GHz for such a radio spectrum. We also show our LzLCS observations on this plot in blue points.
for fth = 0.1, and αnth = −0.8 from Eq. (1). And the dashed vertical line shows the expected value of the thermal fraction at 3 and 6 GHz for such a radio spectrum. We also show our LzLCS observations on this plot in blue points.
Current usage metrics show cumulative count of Article Views (full-text article views including HTML views, PDF and ePub downloads, according to the available data) and Abstracts Views on Vision4Press platform.
Data correspond to usage on the plateform after 2015. The current usage metrics is available 48-96 hours after online publication and is updated daily on week days.
Initial download of the metrics may take a while.