Fig. 1.
Download original image
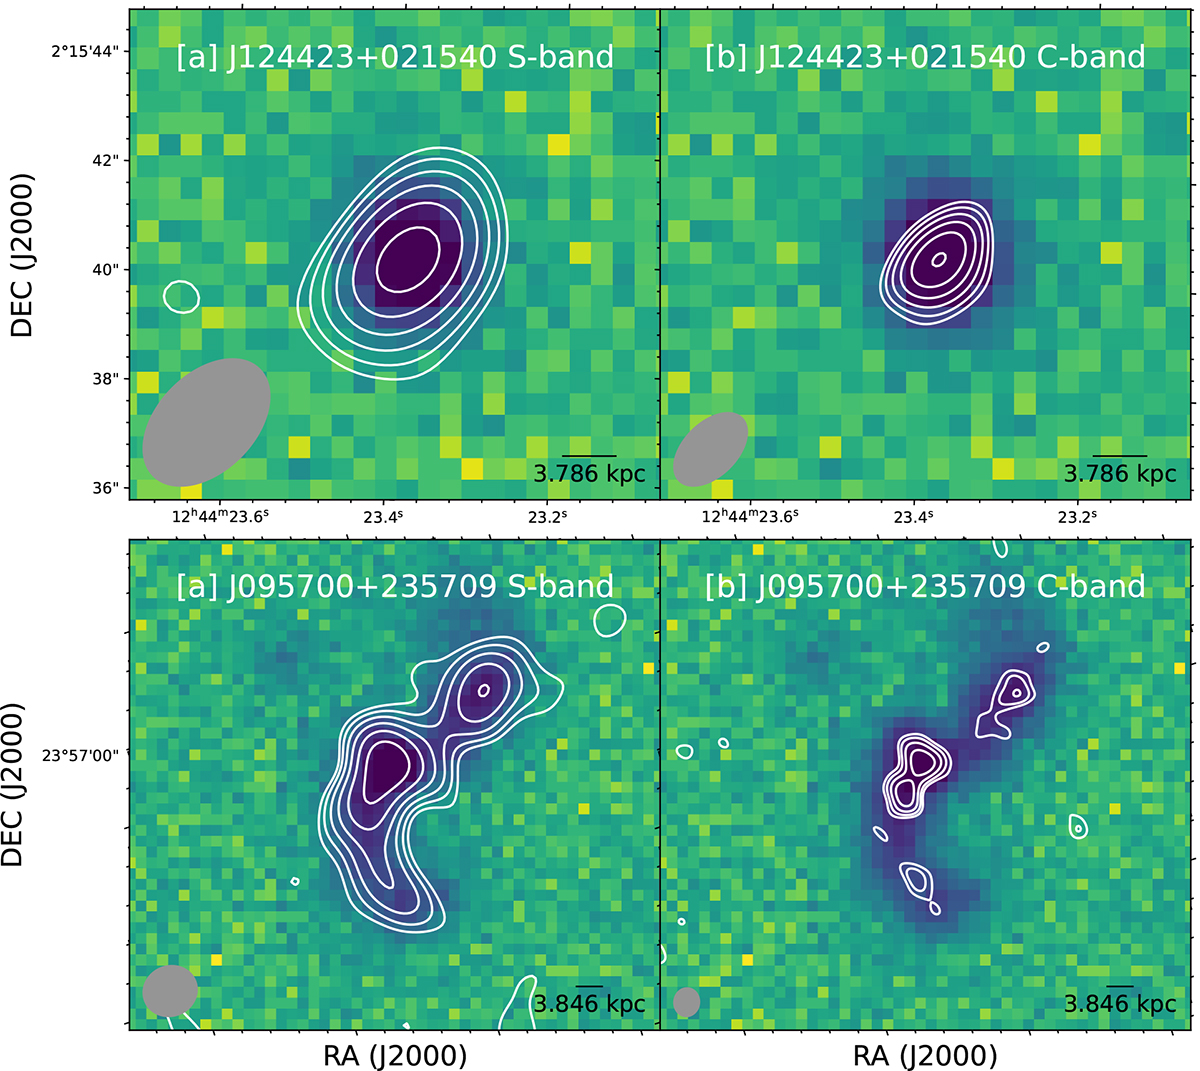
VLA images of two sources in our sample, J124423+021540 (top panels) and J095700+235709 (bottom panels), shown in white contours with the SDSS r-band image (Blanton et al. 2017) in the background. On the left (right) panels we show the VLA S-band (C-band) image contours. The lowest contours in each panels corresponds to 3σ level and they rise in powers of ![]() . σ values correspond to ∼8 and ∼5 μJy beam−1 for S- and C-band respectively.
. σ values correspond to ∼8 and ∼5 μJy beam−1 for S- and C-band respectively.
Current usage metrics show cumulative count of Article Views (full-text article views including HTML views, PDF and ePub downloads, according to the available data) and Abstracts Views on Vision4Press platform.
Data correspond to usage on the plateform after 2015. The current usage metrics is available 48-96 hours after online publication and is updated daily on week days.
Initial download of the metrics may take a while.