Fig. 5
Download original image
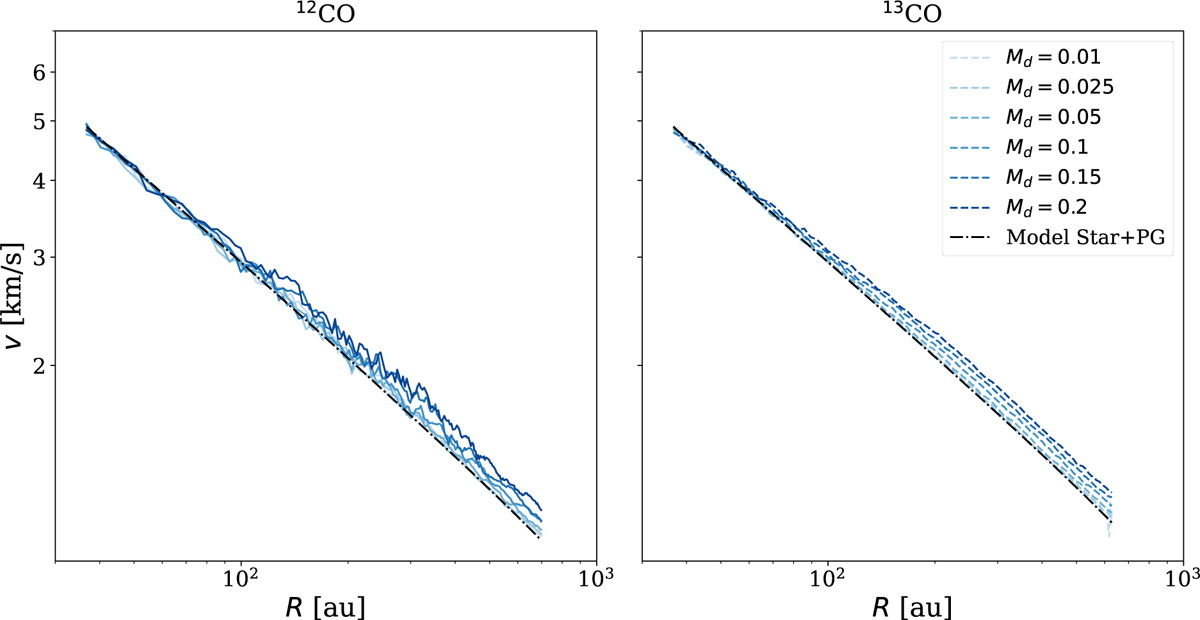
Quadratic rotation curves obtained for all the disc mass simulations (from Mdisc = 0.01 M⊙ to Mdisc = 0.2 M⊙) for the 12CO isotopologue (solid lines in the left panel) and the 13CO isotopologue (dashed lines in the right panel). The black dash-dotted line shows the analytical rotation curve obtained by only considering the star and pressure gradient contribution.
Current usage metrics show cumulative count of Article Views (full-text article views including HTML views, PDF and ePub downloads, according to the available data) and Abstracts Views on Vision4Press platform.
Data correspond to usage on the plateform after 2015. The current usage metrics is available 48-96 hours after online publication and is updated daily on week days.
Initial download of the metrics may take a while.