Fig. 4
Download original image
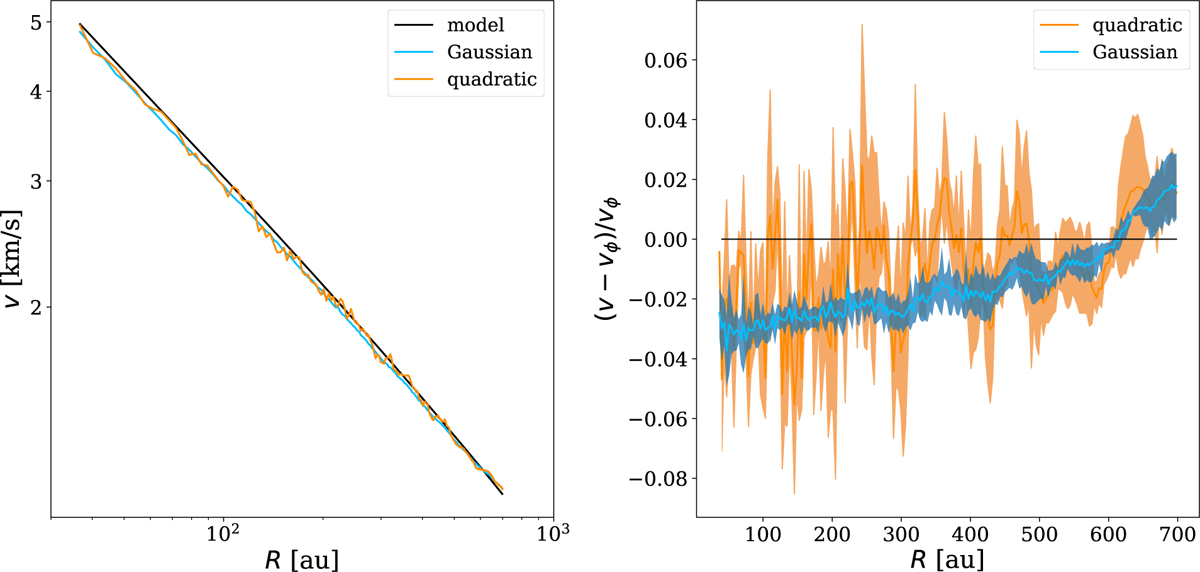
Differences between rotation curves obtained with the Gaussian and quadratic methods. Left panel: comparison between the rotation curves from the model (black line, Eq. (5) with a disc mass of Md = 0.1 M⊙), the Gaussian method (blue line), and the quadratic method (orange line). We observe that the Gaussian curve is systematically shifted with respect to the model. Right panel: difference between the extracted rotation curve (Gaussian method in blue, quadratic method in orange) and the model vϕ from Eq. (5).
Current usage metrics show cumulative count of Article Views (full-text article views including HTML views, PDF and ePub downloads, according to the available data) and Abstracts Views on Vision4Press platform.
Data correspond to usage on the plateform after 2015. The current usage metrics is available 48-96 hours after online publication and is updated daily on week days.
Initial download of the metrics may take a while.