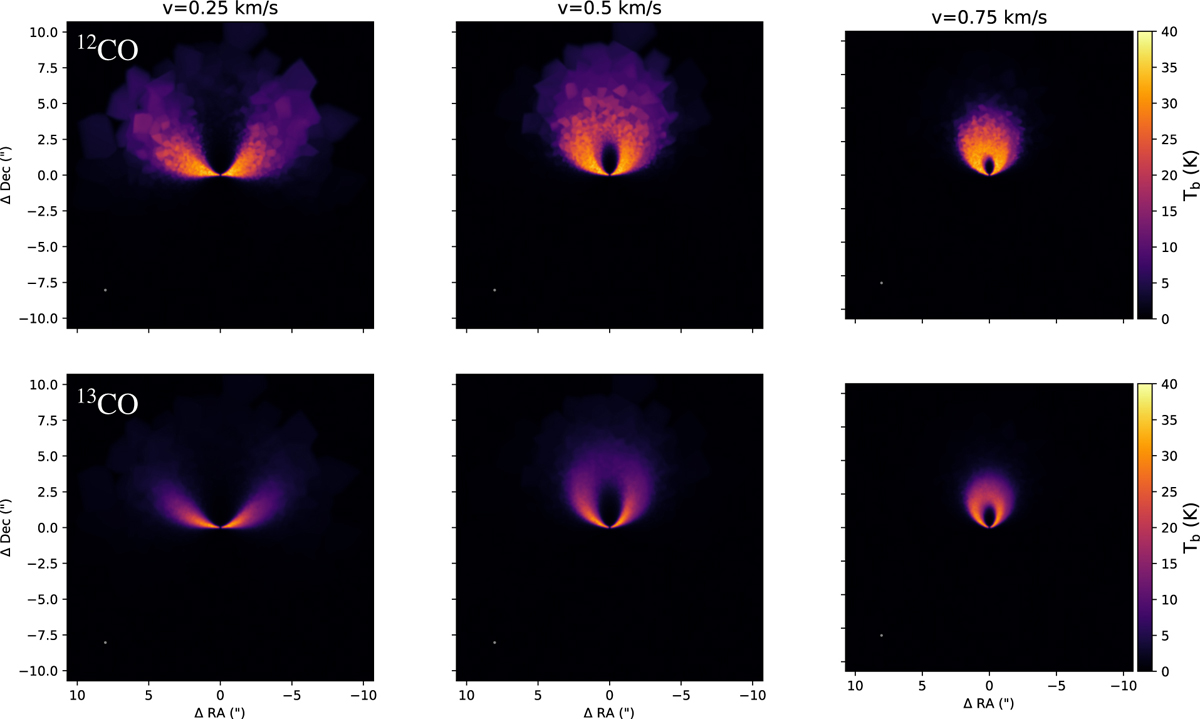
Fig. 2
Download original image
Example of channel maps obtained with MCFOST for the 12CO (top row) and 13CO (bottom row) isotopologues, for a simulation with disc mass of Md = 0.1 M⊙. Different velocity channels are displayed, from 0.25 to 0.75 km s−1 (going from left to right). The chosen Gaussian beam used to convolve the image matches the value of the MAPS survey (0.1″), and is shown with a grey circle in the left bottom corner of each channel map. The velocity resolution is chosen to be 0.1 km s−1 (as in the MAPS survey).
Current usage metrics show cumulative count of Article Views (full-text article views including HTML views, PDF and ePub downloads, according to the available data) and Abstracts Views on Vision4Press platform.
Data correspond to usage on the plateform after 2015. The current usage metrics is available 48-96 hours after online publication and is updated daily on week days.
Initial download of the metrics may take a while.